Fig. 3
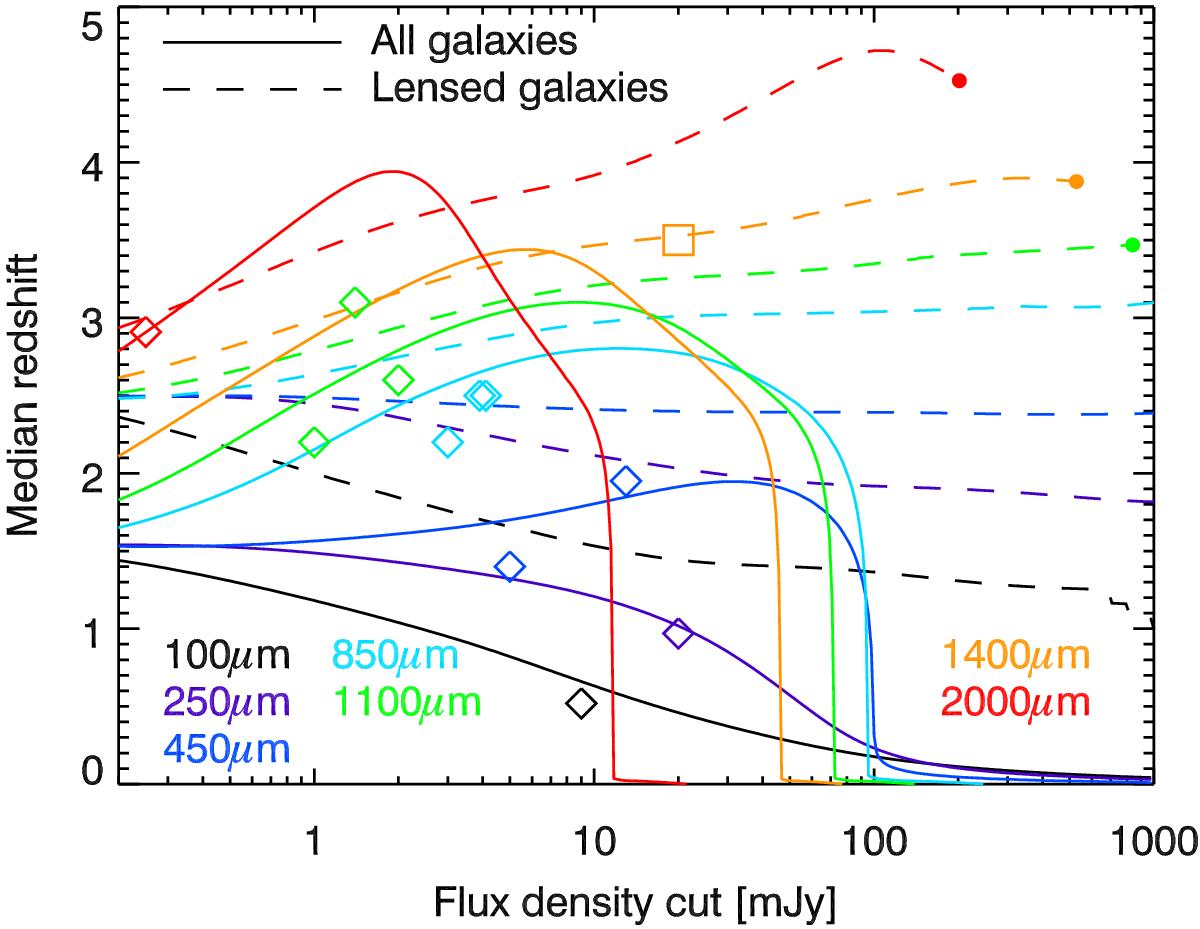
Median redshift of dusty galaxies as a function of the flux cut at various wavelengths (see color coding in the plot). The solid lines correspond to full samples and dashed lines to strongly-lensed samples. The filled dot indicates the limit of one source per 2π sr (about half of the sky is sufficiently clean for extragalactic surveys). The observations listed in Table 1 are symbolized by diamonds (full samples) and a square (SPT lensed sample).
Current usage metrics show cumulative count of Article Views (full-text article views including HTML views, PDF and ePub downloads, according to the available data) and Abstracts Views on Vision4Press platform.
Data correspond to usage on the plateform after 2015. The current usage metrics is available 48-96 hours after online publication and is updated daily on week days.
Initial download of the metrics may take a while.