Fig. 2
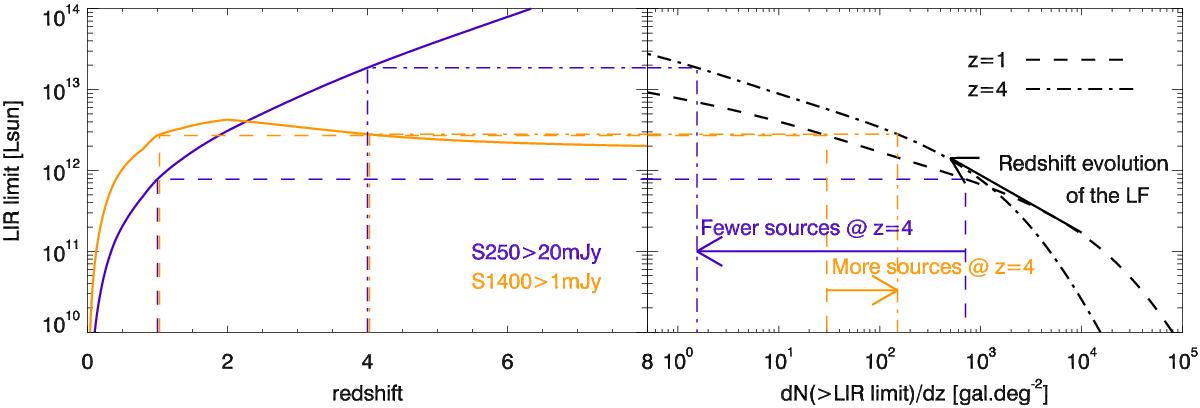
Simplified diagram illustrating the impact of the wavelength on the redshift distribution. Left panel: detection limit in bolometric infrared luminosity (LIR) as a function of redshift for a S250> 20 mJy (purple) and S1400> 1 mJy (gold). These limit are computed using the Magdis et al. (2012) main-sequence SED library. We neglected the scatter and the starburst populations to simplify this diagram. Right panel: number density of objects per redshift interval (computed from the luminosity function and the geometry of the Universe) as a function of the LIR cut (x and y axis are inverted) at z = 1 (dashed line) and z = 4 (dot-dash line). These curves are computed using our model. The colored arrows represent the ratio between the number density of z = 1 and z = 4 sources. The black arrow highlights the increase in the luminosity and the decrease in the density of the knee of the LF between z = 1 and z = 4.
Current usage metrics show cumulative count of Article Views (full-text article views including HTML views, PDF and ePub downloads, according to the available data) and Abstracts Views on Vision4Press platform.
Data correspond to usage on the plateform after 2015. The current usage metrics is available 48-96 hours after online publication and is updated daily on week days.
Initial download of the metrics may take a while.