Fig. 5
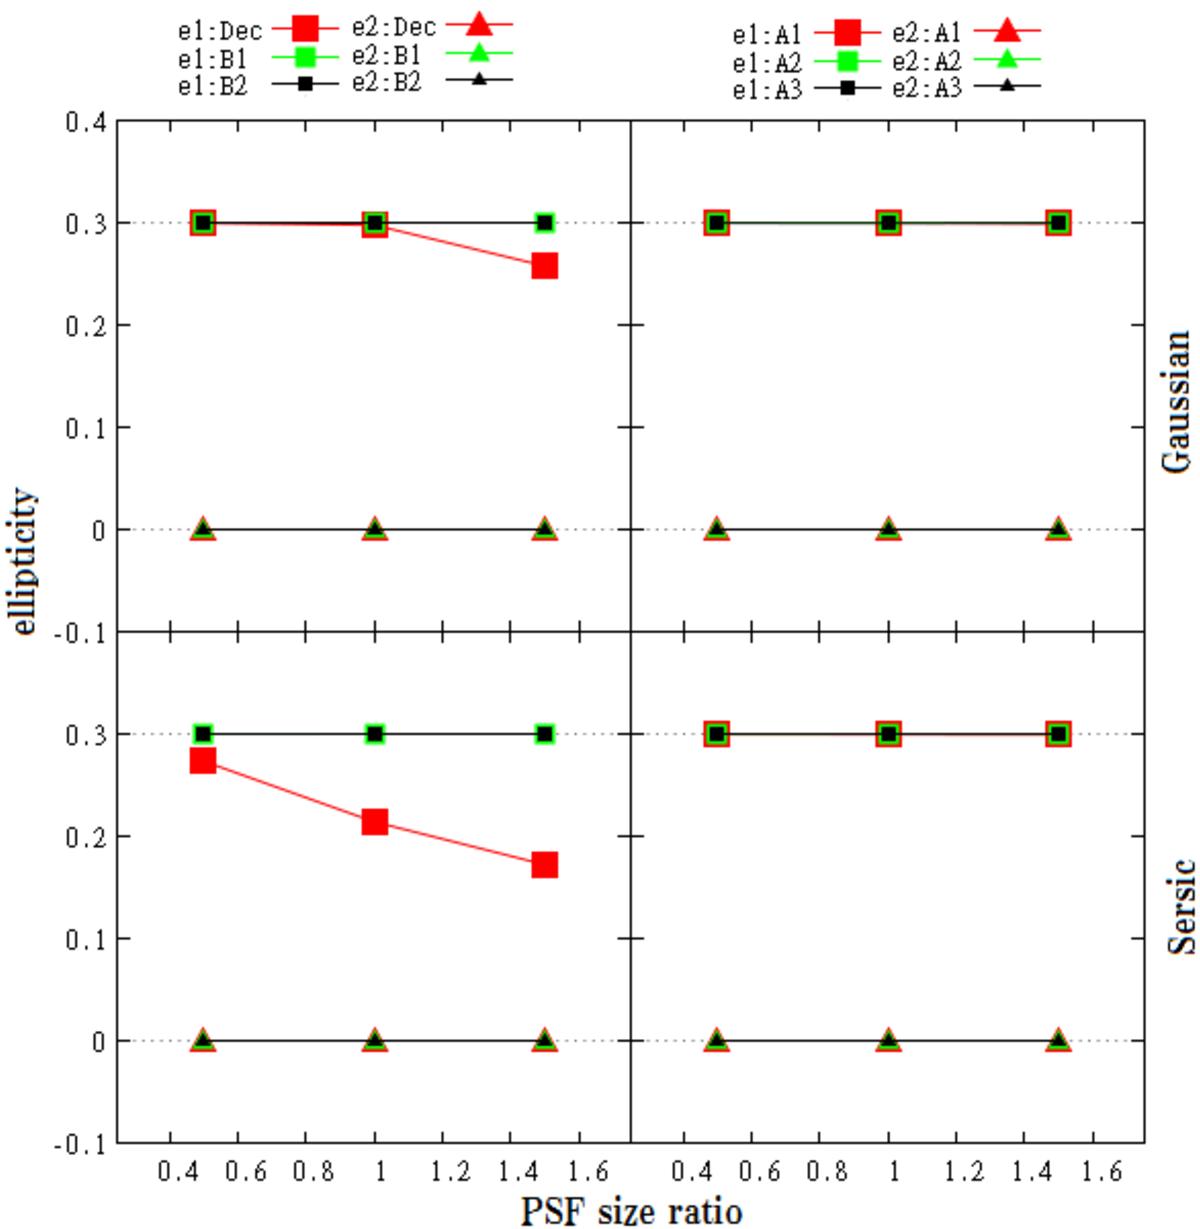
Results of the PSF correction tests with circular PSF. The differences between the four panels are the profile of the galaxy and the analysis method. Top panels are results with Gaussian galaxies and bottom panels are with Sérsic galaxies. Left panels are with methods: red symbols (Dec) indicate PSF correction by deconvolution, green symbols (B1) indicate Method B1, and black symbols (B2) indicate Method B2. Right panels are with methods: red symbols (A1) indicate PSF correction using Method A1, green symbols (A2) indicate use of Method A2, and black symbols (A3) indicate use of Method A3. In each panel, the PSF size ratio (0.5, 1.0, 1.5) is plotted on the horizontal axis and ellipticity with PSF correction is plotted on the vertical axis. Squares indicate ellipticity 1 for which the true value is 0.3, and triangles indicate ellipticity 2 for which the true value is 0.0.
Current usage metrics show cumulative count of Article Views (full-text article views including HTML views, PDF and ePub downloads, according to the available data) and Abstracts Views on Vision4Press platform.
Data correspond to usage on the plateform after 2015. The current usage metrics is available 48-96 hours after online publication and is updated daily on week days.
Initial download of the metrics may take a while.