Fig. 2
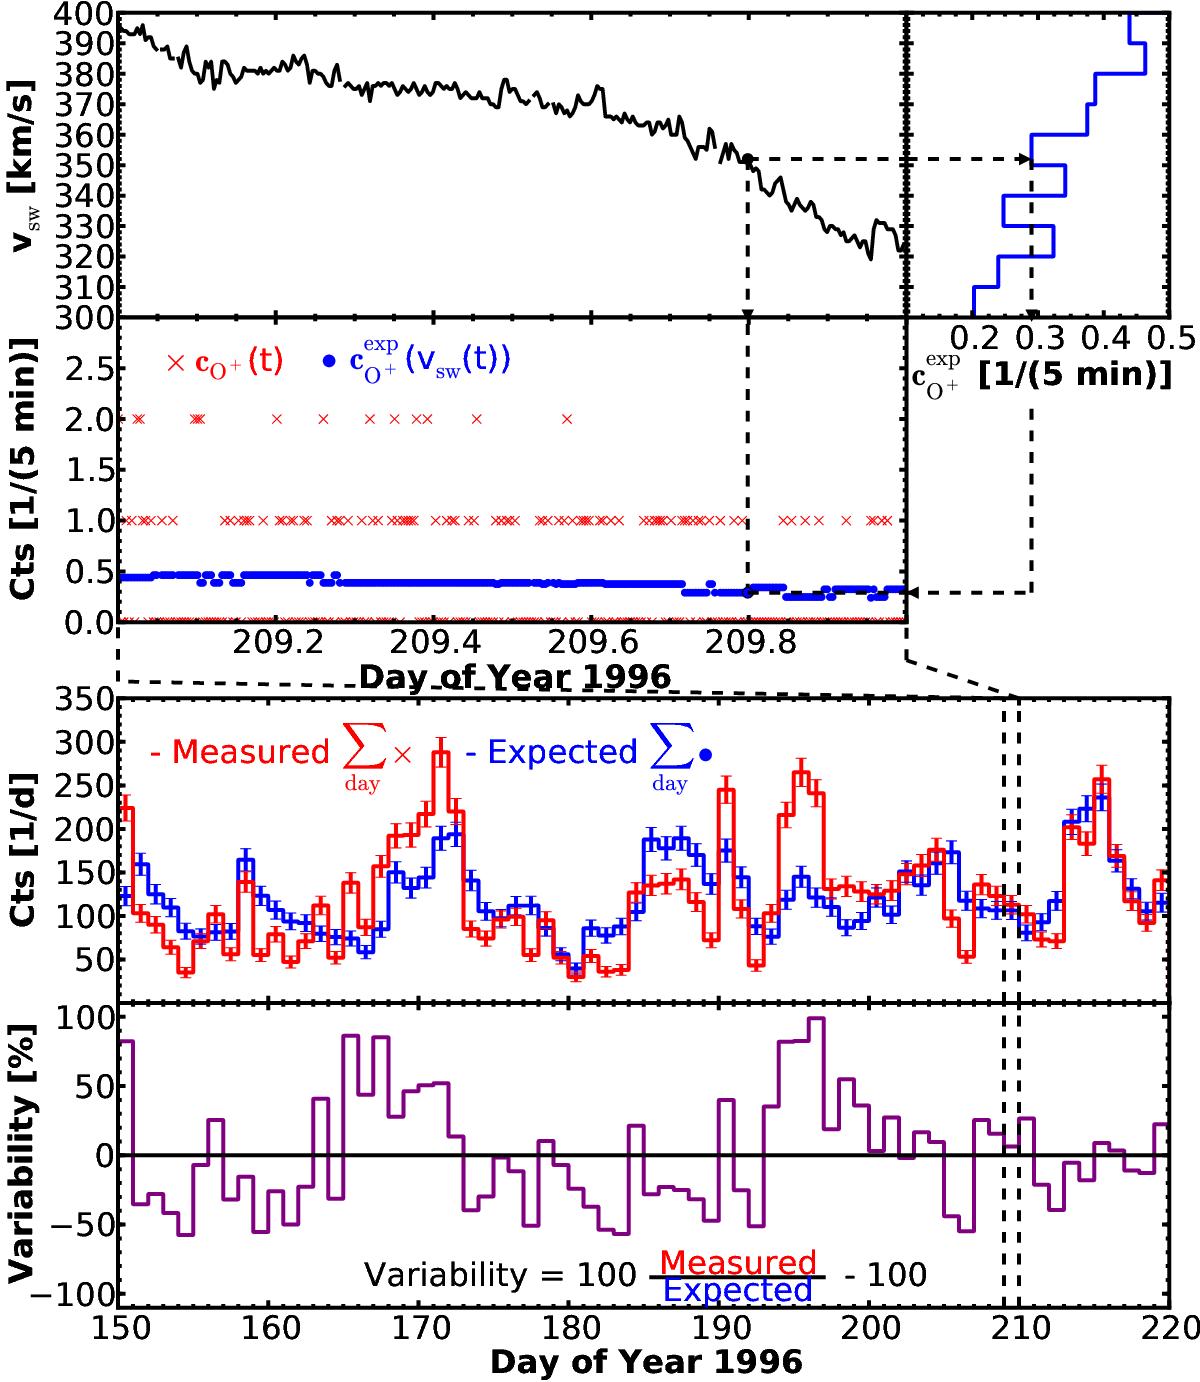
Illustration how O+ daily variabilities are derived. Top main
panel: 5-min solar-wind speeds vsw(t)
(top, left) and expectation values
![]() )
(top, right) are used to construct a time series
of expected counts (blue, bottom). Together with the time series of
observed counts (red, bottom), observed and expected daily values
can be derived. Bottom main panel: time series of observed (red)
and expected (blue) daily counts (top). Error bars denote the
uncertainty due to counting statistic. Finally the time series of the resulting
daily variability is displayed (bottom).
)
(top, right) are used to construct a time series
of expected counts (blue, bottom). Together with the time series of
observed counts (red, bottom), observed and expected daily values
can be derived. Bottom main panel: time series of observed (red)
and expected (blue) daily counts (top). Error bars denote the
uncertainty due to counting statistic. Finally the time series of the resulting
daily variability is displayed (bottom).
Current usage metrics show cumulative count of Article Views (full-text article views including HTML views, PDF and ePub downloads, according to the available data) and Abstracts Views on Vision4Press platform.
Data correspond to usage on the plateform after 2015. The current usage metrics is available 48-96 hours after online publication and is updated daily on week days.
Initial download of the metrics may take a while.