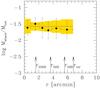
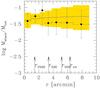
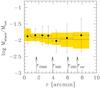
Fig. 3
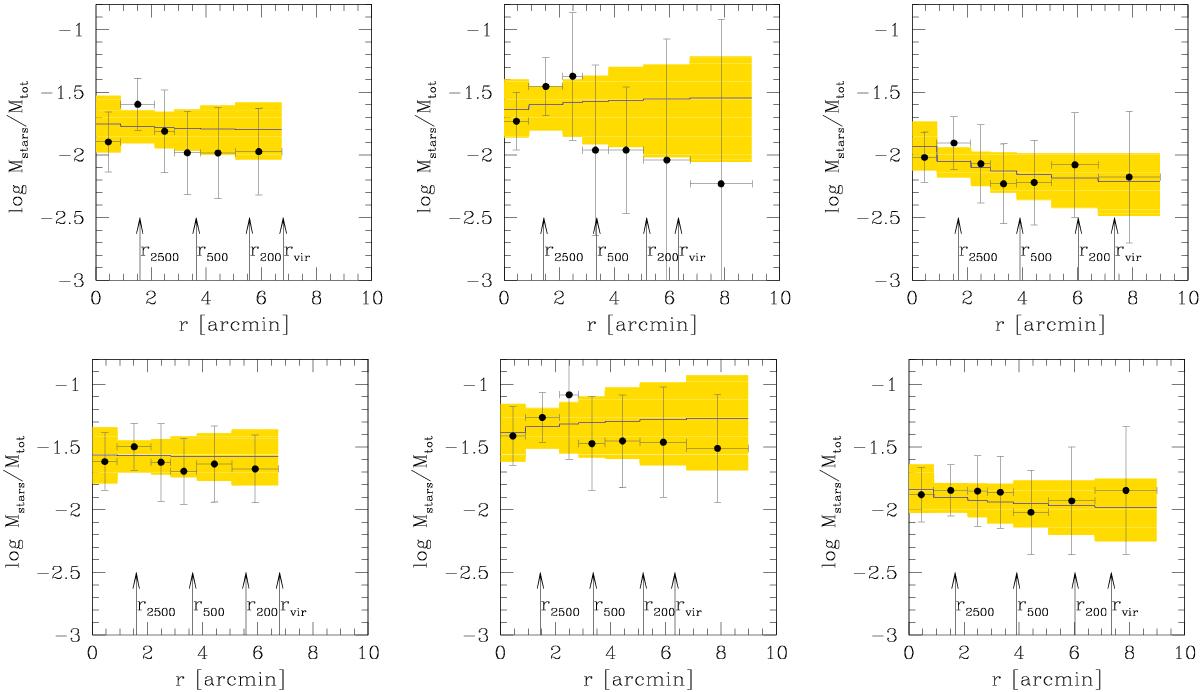
Radial profile of the stellar-to-total matter ratio of MACSJ1206 (left), MACSJ0329 (center), and RXJ1347 (right). The upper panels only consider red sequence galaxies, whereas lower panels consider red galaxies and BCGs. The multi-step function and the shading indicate soundly derived values (posterior mean) and 68 % errors (highest posterior interval), whereas points and error bars are approximate (see text).
Current usage metrics show cumulative count of Article Views (full-text article views including HTML views, PDF and ePub downloads, according to the available data) and Abstracts Views on Vision4Press platform.
Data correspond to usage on the plateform after 2015. The current usage metrics is available 48-96 hours after online publication and is updated daily on week days.
Initial download of the metrics may take a while.