Fig. 2
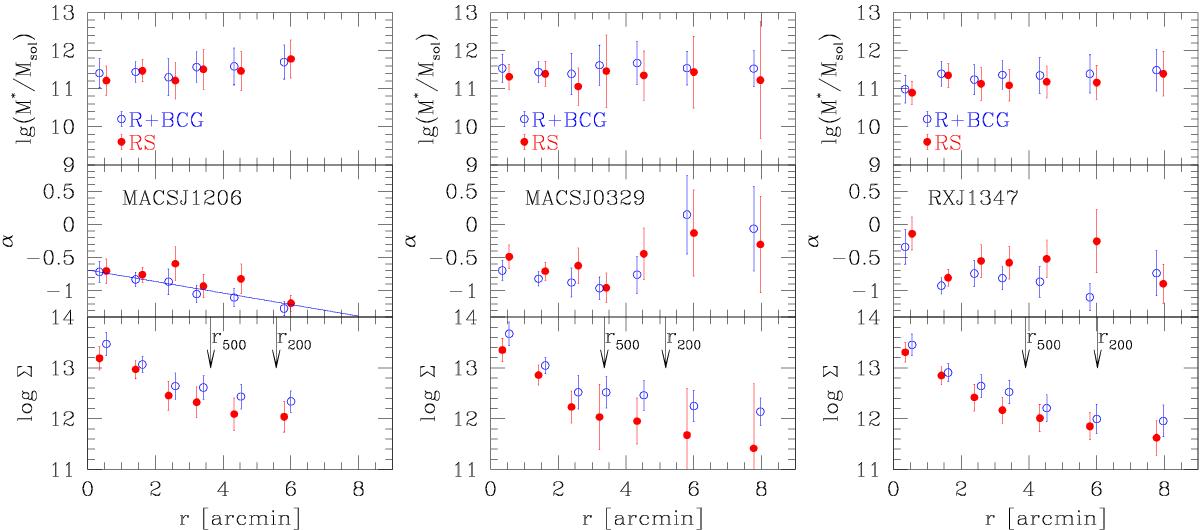
Radial profile of the characteristic stellar mass (upper panels), faint-end slope α (central panels) and projected surface stellar mass density (bottom panels) of the three clusters (MACSJ1206, MACSJ0329, and RXJ1347, from left to right). The central-left panel report the fitted linear trend. Arrows indicate rΔ values and are from Merten et al. (2014). The surface stellar mass density Σ is in M⊙/Mpc2 units.
Current usage metrics show cumulative count of Article Views (full-text article views including HTML views, PDF and ePub downloads, according to the available data) and Abstracts Views on Vision4Press platform.
Data correspond to usage on the plateform after 2015. The current usage metrics is available 48-96 hours after online publication and is updated daily on week days.
Initial download of the metrics may take a while.