Fig. 1
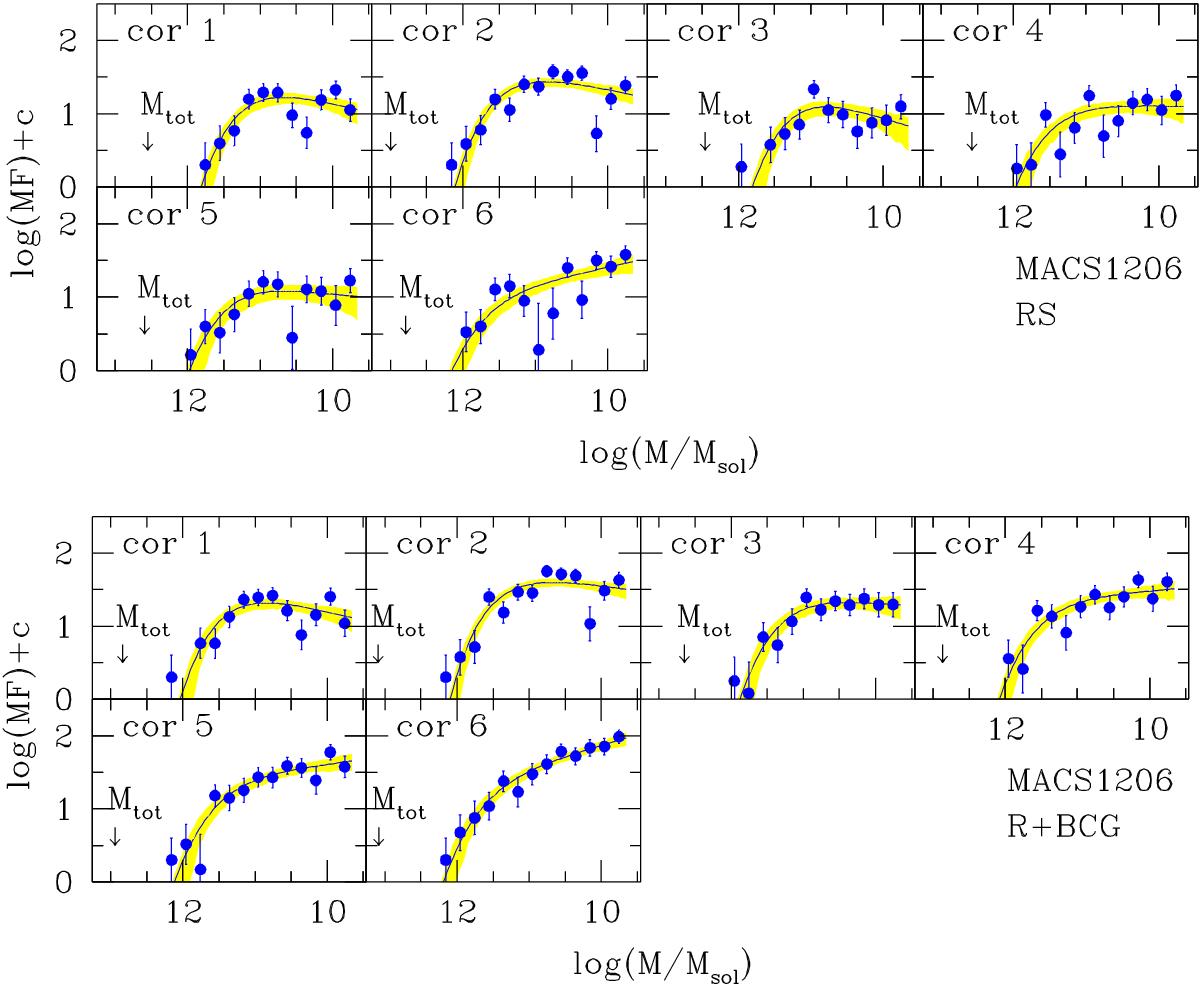
Mass function of red sequence (upper panels) and red galaxies plus BCG (lower panels) of MACSJ1206 in various clustercentric radial bins, as detailed in the panels. The arrow indicates the total mass inside the considered radial bin, disregarding the BCG, if any. The solid line is the mean model fitted to the individual galaxy data, while the shading indicates the 68% uncertainty (highest posterior density interval). Points and approximated error bars are derived by binning galaxies in magnitude bins, adopting approximated Poisson errors summed in quadrature, as commonly done in the literature.
Current usage metrics show cumulative count of Article Views (full-text article views including HTML views, PDF and ePub downloads, according to the available data) and Abstracts Views on Vision4Press platform.
Data correspond to usage on the plateform after 2015. The current usage metrics is available 48-96 hours after online publication and is updated daily on week days.
Initial download of the metrics may take a while.