| Issue |
A&A
Volume 575, March 2015
|
|
|---|---|---|
| Article Number | A114 | |
| Number of page(s) | 9 | |
| Section | Catalogs and data | |
| DOI | https://doi.org/10.1051/0004-6361/201424333 | |
| Published online | 06 March 2015 | |
Bulge RR Lyrae stars in the VVV tile b201⋆
1 Instituto de Astrofísica, Pontificia Universidad Católica de Chile, Vicuña Mackenna 4860, Casilla 306, Santiago, Chile
e-mail: fgran@astro.puc.cl
2 Millennium Institute of Astrophysics (MAS), Santiago, Chile
3 Departamento de Ciencias Fisicas, Universidad Andrés Bello, República 220, Santiago, Chile
4 Vatican Observatory, 00120 Vatican City State, Italy
5 Universidade Federal de Sergipe, Departamento de Física, Av. Marechal Rondon s/n, 49100-000 São Cristóvão, SE, Brazil
6 Jordell Bank Centre for Astrophysics, Alan Turing Building, Manchester, M13 9PL, UK
Received: 3 June 2014
Accepted: 21 November 2014
Context. The VISTA Variables in the Vía Láctea (VVV) Survey is one of the six ESO public surveys currently ongoing at the VISTA telescope on Cerro Paranal, Chile. VVV uses near-IR (ZYJHKs) filters that at present provide photometry to a depth of Ks ~ 17.0 mag in up to 36 epochs spanning over four years, and aim at discovering more than 106 variable sources as well as trace the structure of the Galactic bulge and part of the southern disk.
Aims. A variability search was performed to find RR Lyrae variable stars. The low stellar density of the VVV tile b201, which is centered at (ℓ,b) ~ (−9°, −9°), makes it suitable to search for variable stars. Previous studies have identified some RR Lyrae stars using optical bands that served to test our search procedure. The main goal is to measure the reddening, interstellar extinction, and distances of the RR Lyrae stars and to study their distribution on the Milky Way bulge.
Methods. For each star in the tile with more than 25 epochs (~90% of the objects down to Ks ~ 17.0 mag), the standard deviation and χ2 test were calculated to identify variable candidates. Periods were determined using the analysis of variance. Objects with periods in the RR Lyrae range of 0.2 ≤ P ≤ 1.2 days were selected as candidate RR Lyrae. They were individually examined to exclude false positives.
Results. A total of 1.5 sq deg were analyzed, and we found 39 RR Lyr stars, 27 of which belong to the ab-type and 12 to the c-type. Our analysis recovers all the previously identified RR Lyrae variables in the field and discovers 29 new RR Lyr stars. The reddening and extinction toward all the RRab stars in this tile were derived, and distance estimations were obtained through the period–luminosity relation. Despite the limited amount of RR Lyrae stars studied, our results are consistent with a spheroidal or central distribution around ~8.1 and ~8.5 kpc. for either the Cardelli or Nishiyama extinction law. Our analysis does not reveal a stream-like structure. Nevertheless, a larger area must be analyzed to definitively rule out streams.
Key words: stars: horizontal-branch / stars: variables: RR Lyrae / surveys / Galaxy: bulge
© ESO, 2015
1. Introduction
The structure and evolution of the Galactic bulge is far from completely explored. The high complexity of the Milky Way formation and the fact that we are embedded in the disk of the Galaxy, impede direct observations because of the extensive layer of dust and gas of the Galaxy in this line of sight. In the era of large-surveys, much effort have been made to reveal its structure, taking advantage of a wide variety of near-, mid- and far-IR filters to bypass the layer of dust that does not permit deeper observations in the optical bands (e.g., Freudenreich 1996; Skrutskie et al. 2006; Wright et al. 2010).
In this context, the VISTA Variables in the Vía Láctea (VVV) Survey aims to probe the internal structure of the Milky Way bulge through the near-IR (ZYJHKs) filters, using as its main distance indicators the red-clump giants and pulsating variable stars (Minniti et al. 2010), such as RR Lyrae stars (hereafter RR Lyr), classical Cepheids, anomalous Cepheids and Miras, and semiregular variables. In particular, RR Lyr stars have been useful probes of the bulge structure and evolution (Carney et al. 1995; Gratton & Carretta 1996; McWilliam & Zoccali 2010; Soszyński et al. 2011; Dékány et al. 2013). RR Lyr stars are old and low-mass stars (≈0.7 M⊙; Smith 2004) that are in the horizontal branch (HB) stage (helium-burning phase) and have a very tight period–luminosity (P − L) relation in the near-IR bands (Longmore et al. 1990; Catelan et al. 2004). This relation is a powerful tool that has previously provided distances to Galactic globular clusters (Longmore et al. 1990; Del Principe et al. 2005, 2006; Sollima et al. 2006; Coppola et al. 2011), extragalactic globular clusters, dSph galaxies (Dall’Ora et al. 2004; Pietrzyński et al. 2008; Borissova et al. 2009), and the Galactic center (Carney et al. 1995; Groenewegen et al. 2008; Dékány et al. 2013). Dékány et al. (2013) searched for near-IR counterparts of the RR Lyr stars that were found by the OGLE III survey (Soszyński et al. 2011) in the Galactic bulge in an area limited by 2° ≤ | b | ≤ 7° and | ℓ | ≤ 10°. They derived the distance to the Galactic center and discovered that the RR Lyr trace a more spheroidal shape than the red-clump stars, which suggests that the Milky Way has a composite bulge.
In this paper, we have selected a low density field to conduct a variability search. We find new RR Lyr stars in the VVV tile b201, which allows us to measure precise reddening and distances to the bulge in this direction. The tile b201 samples the spatial distribution of RR Lyr in the older outer bulge, b ≳ 4° away from the Galactic center region analyzed by Dékány et al. (2013). Our motivation also is to update the known RR Lyr stars present at these longitudes (ℓ ~ − 10°) that are covered by the VVV Survey area.
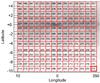 |
Fig. 1 VVV Survey bulge region, shown in Galactic coordinates with its individual numbered tiles. Tile b201 is highlighted in the bottom right corner. The Galactic center is contained in tile b333. Adapted from Catelan et al. (2011b). |
2. Observations
The VVV Survey is being carried out with the 4 m Visible and Infrared Survey Telescope for Astronomy (VISTA) located at ESO’s Cerro Paranal Observatory in Chile, using the wide-field VISTA InfraRed Camera (VIRCAM; Dalton et al. 2006; Emerson & Sutherland 2010). Photometric catalogs are based on the VISTA system, for which 2MASS (Cutri et al. 2003) coordinates are automatically produced by the Cambridge Astronomical Survey Unit (CASU)1. They are publicly available through the VISTA Science Archive (VSA)2. The pixel scale and field of view (FoV) are 0.34′′ pix-1 and 1.64 deg2. This FoV represents one “tile”; the entire VVV observations comprise of 348 tiles (196 covering the bulge and 152 and the southern Galactic plane). The VVV observation schedule includes single-epoch near-IR photometry in ZYJHKs bands and a variability campaign in  with up to a total of 100 epochs planned by the end of the scheduled observing time (1929 h, Minniti et al. 2010; Catelan et al. 2011b). Technical details of the telescope and observation strategy can be found in Minniti et al. (2010) and Saito et al. (2012a).
In this study, we used observations of tile b201 (ℓ,b ≈ − 9°, − 9°; Fig. 1 ). This tile is the bulge field most distant from the Galactic center observed by the VVV, and it has the lowest stellar density, as shown in Fig. 2 of Saito et al. (2012b). The VVV has observed this tile 36 times between April 2010 and July 2013. A total of 394 047 point sources with Ks ≤ 17.0 mag were detected, of which 353 935 have more than 25 epochs of observations, which is the number we require to include a source in this study.
The main reason to choose this tile was its stellar density, lower than other observed VVV bulge tiles. Specifically, for a cutoff of 25 points per light curve, there were 353 935 time series to be analyzed in this tile of the total 394 047 (~10% excluded). This number is similar to that of the adjacent tile b202 with 408 858 sources in Ks band. Another reason for analying this tile is its low extinction with values of AKs ≲ 0.1 mag in certain lines of sight, or equivalently, AV ≤ 0.35 mag (Catelan et al. 2011b; Gonzalez et al. 2011, 2012), which allowed the previous detection of RR Lyr stars by Swope (1942), Ponsen (1954) and Kooreman (1966). Even though it is not completely free of selection biases, the low density implies reduced crowding and a more accurate and deeper photometry than for the other fields in the VVV survey area. Furthermore, the lower extinction in this area minimizes the reddening uncertainties.
2.1. Identifying and classifying variable sources
A semi-automated classification scheme was developed to select the variable stars. First we computed the standard deviation (σKs) and χ2 test for each time series. The cut-off for considering a non-variable star was determined by simulating a random noise χ2 distribution, as described by Carpenter et al. (2001); this resulted in χ2 = 2. This constraint places a lower limit of AKs ≈ 0.03 mag at Ks ≲ 13 mag on the amplitudes of the RR Lyr to be detected. We estimate, based in the ω Cen RRc stars Ks-amplitude distribution (Navarrete et al. 2015), that at Ks~15.2 mag our search procedure has a variability detection efficiency of ~90%, which drops to ~50% at Ks~16.5 mag. These candidates were analyzed by the analysis of variance (AoV) statistics (Schwarzenberg-Czerny 1989) to determine their periods. Periods were restricted to the range in which RR Lyr are typically found: 0.2 ≤ P (days) ≤ 1.2. After this step, the light curves of 167 candidates were visually inspected, and 42 objects were found to be as RR Lyr. Of the remaining 125 light curves, 32 were clearly variables but without a clear variability class, and we classified the remaining 83 as eclipsing-binary candidates. Better phase coverage is needed to classify these variables. Finally, ten variable-star candidates as selected by the algorithm were determined to be non-variables that showed period-aliasing of ≈1 day and were therefore excluded from further analysis. Figure 2 presents the magnitude−variability diagram of all sources with more than 25 epochs of observation, in which the RR Lyr stars are identified.
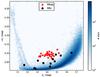 |
Fig. 2 Magnitude–variability diagram for the sources detected in b201 with more than 25 epochs (levels of blue). The contribution of saturated (Ks ≲ 12.0 mag) and faint (Ks ≳ 16.5 mag) stars are clearly visible in the σKs value. RRab are shown as red stars and RRc stars as black circles. |
3. Results
3.1. Catalogue of RR Lyr stars
To characterize our sample of RR Lyr stars, Table 1 contains the number of each variable type found and the mean, longest and shortest periods of each population. These values define the Oosterhoff and Bailey type of the RR Lyr. Additionally, our RR Lyr candidates lie in the magnitude range between 13 ≲Ks (mag) ≲ 16.5, resulting in a distance between 5.2 ≲ d (kpc) ≲ 13.6.
Bailey (1902) classified the RR Lyr (in that epoch called “cluster variables”) in three groups, the a-, b- and c-type by its period and light-curve shape (amplitude of variation). The first two groups were merged later into the ab-type known today. This relation of period and amplitude (today called the Bailey diagram) is shown in the upper panel of Fig. 3.
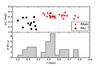 |
Fig. 3 Top: bailey diagram for the 39 RR Lyr variable stars. As expected, there is a clear separation between the amplitude and period among RRab (upper right) and RRc stars (lower left), following the same symbols as in Fig. 2. Bottom: period histogram of the RR Lyr. |
Summary of the periods (in days) of the RR Lyr found in b201.
J and H photometry taken during 2010 and the Ks-mean magnitudes are shown in Table 2. A brief discussion of the error introduced in the RR Lyr color (J − Ks) and (H − Ks) is presented in Sect. 3.5. The RR Lyr stars are shown on a Hess color–magnitude diagram of the whole tile in Fig. 4. The bulge red-giant branch (RGB) and the disk main-sequence (MS) stars are presented in the Hess diagram, with the label aligned in the direction of each branch. The superposition of a young population (the disk) hides the MS turn-off and part of the Galactic bulge HB, where most of our RR Lyr belong. However, the bulge instability strip locus can be inferred over the disk MS in a color range between 0.1 ≲ (J − Ks) ≲ 0.6, according to the position of the RR Lyr in the diagram.
Color information of RRab and RRc stars found in tile b201.
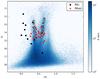 |
Fig. 4 Hess diagram of the tile b201. The disk MS and bulge RGB are easily recognizable from this field and similar to the ones derived in Saito et al. (2012b). The symbols of the RR Lyr are the same as in Fig. 2. |
The period distribution of the RRab and RRc stars is divided by a gap in P ~ 0.4 days, as shown in the bottom panel of Fig. 3, which reflects the distribution derived by Kunder & Chaboyer (2009) in V and R bands. These authors analyzed the Oosterhoff type of RR Lyr in the Galactic bulge. This near-IR diagram shows a different slope for the RRab in the optical wavelengths. It is more horizontal, similar to that reported by Gavrilchenko et al. (2014) and Navarrete et al. (2015) using mid- and near-IR data.
3.2. Previously known RR Lyr stars
As a test of consistency, we compared our RR Lyr positions and periods with those found in the literature. There are already ten variables in the International Variable Star Index3 (VSX) catalog classified as RR Lyr in the analyzed area.
We recovered all ten previously known variables and correctly classified them as RR Lyr. These ten RR Lyr are listed in Table 3, along with their General Catalogue of Variable Stars (GCVS; Samus et al. 2009) designations, periods, and astrometric offsets. In three cases (MO CrA, V397 CrA and V467 CrA), periods different from those in the literature were identified. MO CrA was classified, without an assigned period, as a “cluster variable” by Swope (1942). V397 CrA and V467 CrA were previously observed by Ponsen (1954) and Kooreman (1966), respectively. Ponsen (1954) classified V397 CrA as an RRc, but with only 16 points in the light curve. Kooreman (1966) classified V467 CrA as an RRab, remarking that this star was very faint, with a large dispersion in magnitude in the 120 available plates. V475 CrA and V493 CrA do not have counterparts within our initial 2′′matching radius, but RR Lyr with near identical periods were identified at 17′′ and 31′′, respectively, from their VSX positions. According to CASU, VVV astrometry is accurate to ≈50 mas and the similarity in periods make it very likely that V475 CrA and V493 CrA are counterparts to VVV J2705622.48-420853.7 and VVV J2714823.59-413121.7.
Results of the match with the VVV tile b201 data and the VSX catalog.
Period and Fourier coefficients for the RR Lyr in tile b201.
3.3. RR Lyr star with the shortest period in our catalog
We found that the RRc candidate VVV J2705846.71-411723.2 has a very short period of P = 0.202 days. In contrast, the RRc with the shortest period found in the OGLE III sample has P = 0.237 days (Soszyński et al. 2011). This variable warrants a more detailed study to confirm that it is an RRc instead of an eclipsing binary or a long-period SX Phe, as reported by Cohen & Sarajedini (2012).
3.4. Fourier coefficients
The complete catalog of light curves is shown in Figs. 5 and 6 for the RRab and RRc types. Following an approach similar to that of Dékány et al. (2013), the light curves of the RRab and RRc stars were fitted with Fourier series compound of sines, up to sixth order using the direct Fourier fitting (DFF) method of Kovács & Kupi (2007). This order was the highest possible calculated, but in some cases the returned order was lower to prevent over-fitting of the light-curve. This method allows us to recover the mean Ks-magnitude plus the Fourier coefficients (A21, φ21, ..., A61, φ61), which are shown in Table 4.
The photometric iron abundance of RR Lyr stars is typically found by analyzing of V- and I-band light-curves (e.g., Jurcsik & Kovacs 1996; Smolec 2005). However, since there is no relationship between the Fourier parameters and iron content already established in the near-IR, it cannot be determined individually for our variables. Hence, we used the value of Pietrukowicz et al. (2012), who found that RR Lyr trace the distribution of the metallicity in the Galactic bulge with a sharply peaked distribution, centered on −1.02 dex with a dispersion of 0.25 dex. This metallicity completely agrees with the spectroscopic value found by Walker & Terndrup (1991) of ⟨ [ Fe/H] ⟩ = −1.0 dex with a dispersion of 0.16 dex. They analyzed 59 RR Lyr in Baade’s window. Taking a fixed metallicity does not significantly affect the distance estimation; it imparts a mean of 0.20 kpc (~3% at 8 kpc) uncertainty to distances derived using the P − L relation, taking into account the extreme values on the dispersion of [Fe/H].
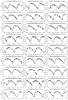 |
Fig. 5 30 RRab stars found in tile b201, sorted by increasing period. The solid line represents the Fourier decomposition of each RR Lyr using the DFF method. The internal name and period are indicated at the top of each light-curve. Error bars are plotted, but are generally smaller than the point sizes. |
3.5. RR Lyr stars: reddening estimation
Generally, the reddening can be expressed as the difference of the measured and intrinsic color between two filters,  (1)in this case for J and Ks. The first term of the equation is limited by the phase coverage and the number of points of each variable in multiple wavelengths. The VVV, as a variability survey, provides time-series exclusively in Ks band. For J and H band, only one observation has been taken during the first year of operation, which limits the precision of (J − Ks) and (H − Ks). The colors (J − H) and (H − Ks) were calculated using the faintest point of the light curve according to the Fourier fit, and taking into account the ratio of amplitudes between J, H and Ks described in Feast et al. (2008), as follows:
  This approximation has a larger error for the shorter-period RRab (higher amplitudes) with a maximum of ± 0.2 mag and ± 0.1 mag for the J and H band, respectively. However, for Z and Y bands (also available in the VVV Survey), we are unable to conduct the same analysis because we lack detailed near-IR variability studies. This problem can be solved in the future with a database of well-defined near-IR template light-curves that the VVV Templates Project (Catelan et al. 2011a; Angeloni et al. 2014) is collecting. The next step was to calculate the intrinsic color of the sample, that is (J − Ks)0, analogous to the difference in absolute magnitude of the two filters. This modifies the latter reddening equation into
  (4)for J and Ks bands. The absolute magnitudes were calculated using the P − L relation given in Alonso-García et al. (2015),
 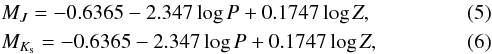 with σJ = 0.17 mag and σKs = 0.13 mag the systematic errors in J and Ks bands, respectively. The errors were calculated as the difference between the average magnitudes, published by Del Principe et al. (2005), and the theoretical values obtained using the P − L relations listed above. The theoretical propagated error of (J − Ks)0 is ~0.21 mag, which introduces a difference of 0.14 mag in the distance moduli. These relations are crucial for determining the distances to our RR Lyr stars, because it is a very accurate solution to calculate the reddening corrected colors, especially in the near-IR (Catelan et al. 2004). We used the same approach as Pietrukowicz et al. (2012) to calculate the log Z = [ Fe/H] − 1.765, based on a solar metallicity of Z⊙ = 0.017 (Catelan et al. 2004). This relation was established for fundamental-mode pulsators, therefore we must exclude the RRc stars of future analyses. Finally, these colors give us an estimate of the individual reddening of the RRab stars, which is shown in Table 5. We compared these reddening values with those obtained by Kunder et al. (2008) in the same Galactic latitude as our values (ℓ,b ~ − 5°, − 9°) from the Galactic bulge fields of the MACHO survey. The mean converted value of E(J − Ks) at that latitude is ~0.20 mag, with a dispersion of 0.04 mag, which is consistent with our measurements within the errors. In some cases, our estimates are slightly higher than those of Kunder et al. (2008), which may be due to larger distances or larger errors in the determination of the color (J − Ks) in our light curves.
Reddening, extinction, and distances computed for the RR Lyr found in tile b201.
3.6. Distance to the RR Lyrae stars
We calculated the individual distances to the RRab stars using the P − L relations for the Ks band. This distance can be expressed in terms of the absolute and the extinction-corrected Ks-band magnitudes,  (7)with R the individual distance in pc to our RRab stars and converting the color excess into extinction using the law of Cardelli et al. (1989),
  (8)Figure 7 shows the histogram of the distances calculated for the individual RR Lyr. A strong agreement with previous results is recovered even at this high latitude (ℓ ~ − 10°) with more than the 50% of the variables in the central kiloparsec according to a Gaussian fit with dmean = 8.14 kpc and a dispersion of σd = 1.56 kpc. Adopting the reddening law of Nishiyama et al. (2009) does not significantly change the distance distribution of our RRab stars; it adds 0.4 kpc to the mean, but keeps the dispersion unchanged.
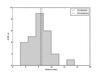 |
Fig. 7 Distance to the sample of RR Lyr stars in tile b201 in a 1.2 kpc binning size. The solid (D13) and dashed lines (P11) represent the values of the Galactic center distance given in Dékány et al. (2013) and Pietrukowicz et al. (2012). |
The results of this analysis, including reddening, extinction, and distances with their error are shown in Table 5. The uncertainties consider the error propagation on the color, reddening, extinction, and distance of each individual RRab star. Another visualization of the derived distances, assuming a constant ℓ and b coordinate, is shown in Fig. 8 as a cone view. This approach is useful in identifying groups or streams of variable stars in our FoV, which is not possible with their spatial distribution (ℓ,b) alone, as also shown in Fig. 8. Although there may be a group of RR ab stars at d ~ 7 kpc, these stars do not cluster in any other parameters, for example, in the period-amplitude diagram or spatially, and hence we are hesitant to consider them as a group.
An interesting topic of the RR Lyr studied in large areas is the possibility that they can trace an old stream-like structure (Sesar et al. 2013) in addition to the spheroidal shape described by Dékány et al. (2013). Unfortunately, the small number of variables in this single tile prevent us from making any strong statements about the presence of streams in this direction.
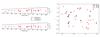 |
Fig. 8 Left: distance to the sample of RR Lyr stars, between 5 and 10 kpc, in a cone view. We did not find any apparent cluster or group in the RRab due to streams, except for the variables in the Galactic center. The solid and dashed lines have the same meaning as in Fig. 7. Right: spatial distribution in Galactic coordinates of the 39 RR Lyr found in tile b201. |
4. Summary
A search for RR Lyr stars was performed in the VVV tile b201, one of the outermost bulge regions covered by the VVV Survey. A total of 39 RR Lyr were found, of which 27 and 12 belong to the ab- and c-type, respectively. For the total sample, coordinates, periods, amplitudes, and near-IR colors were presented. Using the International Variable Star Index, we found counterparts of the ten previously known RR Lyr in the field, in agreement with past measurements. We found differences in only three of them, for which we suggested a revised period. From the analysis of the RRab sample, individual reddening, extinction, and distance were obtained, based on line-of-sight extinction values given by Cardelli et al. (1989) and the P − L relation of Alonso-García et al. (2015). The distribution of these variables on the Milky Way follows a central distribution around ~8.1 and ~8.5 kpc using the Cardelli or Nishiyama extinction law, respectively. This value is consistent with the results of Dékány et al. (2013), placing the center of the distribution at ~8.3 kpc. An analysis of a larger area around ℓ ~ − 10° will be conducted to complement the studies of the inner Galactic bulge that are already published.
Acknowledgments
We thank the anonymous referee for comments that helped improve the presentation of our results. We gratefully acknowledge the use of data from the ESO Public Survey program ID 179.B-2002 taken with the VISTA telescope, data products from the Cambridge Astronomical Survey Unit. Support for the authors is provided by the BASAL CATA Center for Astrophysics and Associated Technologies through grant PFB-06, and the Ministry for the Economy, Development, and Tourism’s Programa Iniciativa Científica Milenio through grant IC 120009, awarded to Millenium Institute of Astrophysics (MAS), FONDECYT Regular grants No. 1130196 (D.M.) and 1141141 (M.C., C.N., F.G.). F.G. and C.N. acknowledge support from CONICYT-PCHA Magíster Nacional 2014-22141509 and 2012-22121934, respectively. R.C.R. acknowledges support by Proyecto Fondecyt Postdoctoral #3130320. R.K.S. acknowledges support from CNPq/Brazil through projects 310636/2013-2 and 481468/2013-7. We gratefully acknowledge the use of IPython (Pérez & Granger 2007), TOPCAT (Taylor 2005), and the ALADIN sky atlas (Bonnarel et al. 2000) in this research and the International Variable Star Index (VSX) database, operated at AAVSO, Cambridge, Massachusetts, USA.
References
- Alonso-García, J., Dékány, I., Catelan, M., et al. 2015, AJ, 149, 99 [NASA ADS] [CrossRef] [Google Scholar]
- Angeloni, R., Contreras Ramos, R., Catelan, M., et al. 2014, A&A, 567, A100 [NASA ADS] [CrossRef] [EDP Sciences] [Google Scholar]
- Bailey, S. I. 1902, Annals of Harvard College Observatory, 38, 1 [Google Scholar]
- Bonnarel, F., Fernique, P., Bienaymé, O., et al. 2000, A&AS, 143, 33 [NASA ADS] [CrossRef] [EDP Sciences] [Google Scholar]
- Borissova, J., Rejkuba, M., Minniti, D., Catelan, M., & Ivanov, V. D. 2009, A&A, 502, 505 [NASA ADS] [CrossRef] [EDP Sciences] [Google Scholar]
- Cardelli, J. A., Clayton, G. C., & Mathis, J. S. 1989, ApJ, 345, 245 [NASA ADS] [CrossRef] [Google Scholar]
- Carney, B. W., Fulbright, J. P., Terndrup, D. M., Suntzeff, N. B., & Walker, A. R. 1995, AJ, 110, 1674 [NASA ADS] [CrossRef] [Google Scholar]
- Carpenter, J. M., Hillenbrand, L. A., & Skrutskie, M. F. 2001, AJ, 121, 3160 [NASA ADS] [CrossRef] [Google Scholar]
- Catelan, M., Angeloni, R., Dékány, I., et al. 2011a, Rev. Mex. Astron. Astrofis. Conf. Ser., 40, 269 [NASA ADS] [Google Scholar]
- Catelan, M., Minniti, D., Lucas, P. W., et al. 2011b, in RR Lyrae Stars, Metal-Poor Stars, and the Galaxy, ed. A. McWilliam, 145 [Google Scholar]
- Catelan, M., Pritzl, B. J., & Smith, H. A. 2004, ApJS, 154, 633 [Google Scholar]
- Cohen, R. E., & Sarajedini, A. 2012, MNRAS, 419, 342 [NASA ADS] [CrossRef] [Google Scholar]
- Coppola, G., Dall’Ora, M., Ripepi, V., et al. 2011, MNRAS, 416, 1056 [NASA ADS] [CrossRef] [Google Scholar]
- Cutri, R. M., Skrutskie, M. F., van Dyk, S., et al. 2003, VizieR Online Data Catalog: II/246 [Google Scholar]
- Dall’Ora, M., Storm, J., Bono, G., et al. 2004, ApJ, 610, 269 [NASA ADS] [CrossRef] [Google Scholar]
- Dalton, G. B., Caldwell, M., Ward, A. K., et al. 2006, SPIE Conf. Ser., 6269, 4 [NASA ADS] [Google Scholar]
- Dékány, I., Minniti, D., Catelan, M., et al. 2013, ApJ, 776, L19 [NASA ADS] [CrossRef] [Google Scholar]
- Del Principe, M., Piersimoni, A. M., Bono, G., et al. 2005, AJ, 129, 2714 [NASA ADS] [CrossRef] [Google Scholar]
- Del Principe, M., Piersimoni, A. M., Storm, J., et al. 2006, ApJ, 652, 362 [NASA ADS] [CrossRef] [Google Scholar]
- Emerson, J. P., & Sutherland, W. J. 2010, SPIE Conf. Ser., 7733 [Google Scholar]
- Feast, M. W., Laney, C. D., Kinman, T. D., van Leeuwen, F., & Whitelock, P. A. 2008, MNRAS, 386, 2115 [NASA ADS] [CrossRef] [Google Scholar]
- Freudenreich, H. T. 1996, ApJ, 468, 663 [NASA ADS] [CrossRef] [Google Scholar]
- Gavrilchenko, T., Klein, C. R., Bloom, J. S., Richards, J., & Butler, N. 2014, AAS Meet. Abstracts, 223, 156.11 [Google Scholar]
- Gonzalez, O. A., Rejkuba, M., Zoccali, M., Valenti, E., & Minniti, D. 2011, A&A, 534, A3 [NASA ADS] [CrossRef] [EDP Sciences] [Google Scholar]
- Gonzalez, O. A., Rejkuba, M., Zoccali, M., et al. 2012, A&A, 543, A13 [NASA ADS] [CrossRef] [EDP Sciences] [Google Scholar]
- Gratton, R., & Carretta, E. 1996, in Formation of the Galactic Halo...Inside and Out, eds. H. L. Morrison, & A. Sarajedini, ASP Conf. Ser., 92, 371 [Google Scholar]
- Groenewegen, M. A. T., Udalski, A., & Bono, G. 2008, A&A, 481, 441 [NASA ADS] [CrossRef] [EDP Sciences] [Google Scholar]
- Jurcsik, J., & Kovacs, G. 1996, A&A, 312, 111 [NASA ADS] [Google Scholar]
- Kooreman, C. J. 1966, Annalen van de Sterrewacht te Leiden, 22, 159 [NASA ADS] [Google Scholar]
- Kovács, G., & Kupi, G. 2007, A&A, 462, 1007 [NASA ADS] [CrossRef] [EDP Sciences] [Google Scholar]
- Kunder, A., & Chaboyer, B. 2009, AJ, 138, 1284 [NASA ADS] [CrossRef] [Google Scholar]
- Kunder, A., Popowski, P., Cook, K. H., & Chaboyer, B. 2008, AJ, 135, 631 [NASA ADS] [CrossRef] [Google Scholar]
- Longmore, A. J., Dixon, R., Skillen, I., Jameson, R. F., & Fernley, J. A. 1990, MNRAS, 247, 684 [NASA ADS] [Google Scholar]
- McWilliam, A., & Zoccali, M. 2010, ApJ, 724, 1491 [NASA ADS] [CrossRef] [Google Scholar]
- Minniti, D., Lucas, P. W., Emerson, J. P., et al. 2010, New A, 15, 433 [Google Scholar]
- Navarrete, C., Contreras Ramos, R., Catelan, M., et al. 2015, A&A, accepted [Google Scholar]
- Nishiyama, S., Tamura, M., Hatano, H., et al. 2009, ApJ, 696, 1407 [NASA ADS] [CrossRef] [Google Scholar]
- Pérez, F., & Granger, B. E. 2007, Comp. Sci. Eng., 9, 21 [Google Scholar]
- Pietrukowicz, P., Udalski, A., Soszyński, I., et al. 2012, ApJ, 750, 169 [NASA ADS] [CrossRef] [Google Scholar]
- Pietrzyński, G., Gieren, W., Szewczyk, O., et al. 2008, AJ, 135, 1993 [NASA ADS] [CrossRef] [Google Scholar]
- Ponsen, J. 1954, Annalen van de Sterrewacht te Leiden, 20, 369 [NASA ADS] [Google Scholar]
- Saito, R. K., Hempel, M., Minniti, D., et al. 2012a, A&A, 537, A107 [NASA ADS] [CrossRef] [EDP Sciences] [Google Scholar]
- Saito, R. K., Minniti, D., Dias, B., et al. 2012b, A&A, 544, A147 [NASA ADS] [CrossRef] [EDP Sciences] [Google Scholar]
- Samus, N. N., Durlevich, O. V., et al. 2009, VizieR Online Data Catalog, B/gcvs [Google Scholar]
- Schwarzenberg-Czerny, A. 1989, MNRAS, 241, 153 [NASA ADS] [CrossRef] [Google Scholar]
- Sesar, B., Grillmair, C. J., Cohen, J. G., et al. 2013, ApJ, 776, 26 [NASA ADS] [CrossRef] [Google Scholar]
- Skrutskie, M. F., Cutri, R. M., Stiening, R., et al. 2006, AJ, 131, 1163 [NASA ADS] [CrossRef] [Google Scholar]
- Smith, H. A. 2004, RR Lyrae Stars (Cambridge: Cambridge University Press) [Google Scholar]
- Smolec, R. 2005, Acta Astron., 55, 59 [NASA ADS] [Google Scholar]
- Sollima, A., Cacciari, C., & Valenti, E. 2006, MNRAS, 372, 1675 [NASA ADS] [CrossRef] [Google Scholar]
- Soszyński, I., Dziembowski, W. A., Udalski, A., et al. 2011, Acta Astron., 61, 1 [NASA ADS] [Google Scholar]
- Swope, H. H. 1942, Annals of Harvard College Observatory, 109, 41 [NASA ADS] [Google Scholar]
- Taylor, M. B. 2005, in Astronomical Data Analysis Software and Systems XIV, eds. P. Shopbell, M. Britton, & R. Ebert, ASP Conf. Ser., 347, 29 [Google Scholar]
- Walker, A. R., & Terndrup, D. M. 1991, ApJ, 378, 119 [NASA ADS] [CrossRef] [Google Scholar]
- Wright, E. L., Eisenhardt, P. R. M., Mainzer, A. K., et al. 2010, AJ, 140, 1868 [NASA ADS] [CrossRef] [Google Scholar]
All Tables
All Figures
|
Fig. 1 VVV Survey bulge region, shown in Galactic coordinates with its individual numbered tiles. Tile b201 is highlighted in the bottom right corner. The Galactic center is contained in tile b333. Adapted from Catelan et al. (2011b). |
| In the text | |
|
Fig. 2 Magnitude–variability diagram for the sources detected in b201 with more than 25 epochs (levels of blue). The contribution of saturated (Ks ≲ 12.0 mag) and faint (Ks ≳ 16.5 mag) stars are clearly visible in the σKs value. RRab are shown as red stars and RRc stars as black circles. |
| In the text | |
|
Fig. 3 Top: bailey diagram for the 39 RR Lyr variable stars. As expected, there is a clear separation between the amplitude and period among RRab (upper right) and RRc stars (lower left), following the same symbols as in Fig. 2. Bottom: period histogram of the RR Lyr. |
| In the text | |
|
Fig. 4 Hess diagram of the tile b201. The disk MS and bulge RGB are easily recognizable from this field and similar to the ones derived in Saito et al. (2012b). The symbols of the RR Lyr are the same as in Fig. 2. |
| In the text | |
|
Fig. 5 30 RRab stars found in tile b201, sorted by increasing period. The solid line represents the Fourier decomposition of each RR Lyr using the DFF method. The internal name and period are indicated at the top of each light-curve. Error bars are plotted, but are generally smaller than the point sizes. |
| In the text | |
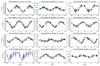 |
Fig. 6 Same as Fig. 5, but for the RRc stars. |
| In the text | |
|
Fig. 7 Distance to the sample of RR Lyr stars in tile b201 in a 1.2 kpc binning size. The solid (D13) and dashed lines (P11) represent the values of the Galactic center distance given in Dékány et al. (2013) and Pietrukowicz et al. (2012). |
| In the text | |
|
Fig. 8 Left: distance to the sample of RR Lyr stars, between 5 and 10 kpc, in a cone view. We did not find any apparent cluster or group in the RRab due to streams, except for the variables in the Galactic center. The solid and dashed lines have the same meaning as in Fig. 7. Right: spatial distribution in Galactic coordinates of the 39 RR Lyr found in tile b201. |
| In the text | |
Current usage metrics show cumulative count of Article Views (full-text article views including HTML views, PDF and ePub downloads, according to the available data) and Abstracts Views on Vision4Press platform.
Data correspond to usage on the plateform after 2015. The current usage metrics is available 48-96 hours after online publication and is updated daily on week days.
Initial download of the metrics may take a while.