Free Access
Fig. 5
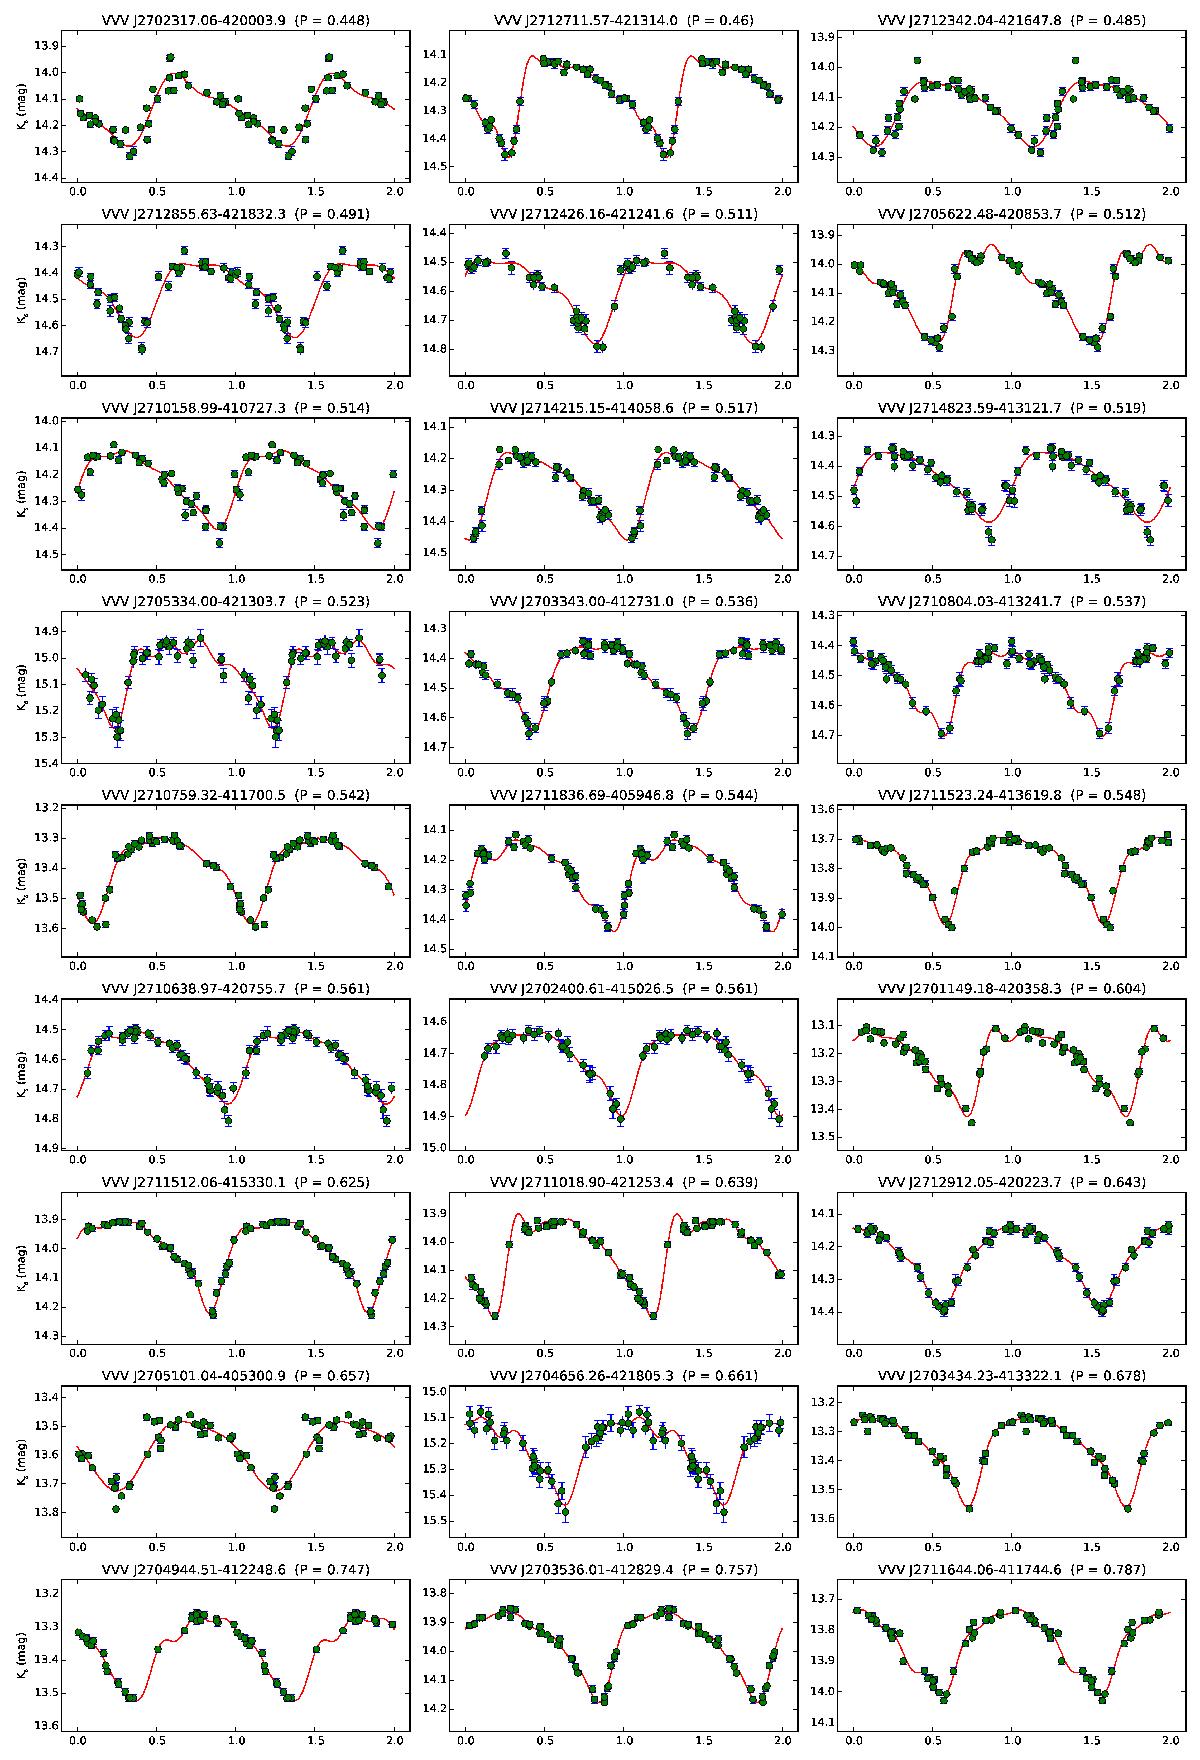
30 RRab stars found in tile b201, sorted by increasing period. The solid line represents the Fourier decomposition of each RR Lyr using the DFF method. The internal name and period are indicated at the top of each light-curve. Error bars are plotted, but are generally smaller than the point sizes.
Current usage metrics show cumulative count of Article Views (full-text article views including HTML views, PDF and ePub downloads, according to the available data) and Abstracts Views on Vision4Press platform.
Data correspond to usage on the plateform after 2015. The current usage metrics is available 48-96 hours after online publication and is updated daily on week days.
Initial download of the metrics may take a while.