| Issue |
A&A
Volume 575, March 2015
|
|
|---|---|---|
| Article Number | A121 | |
| Number of page(s) | 12 | |
| Section | Astrophysical processes | |
| DOI | https://doi.org/10.1051/0004-6361/201322695 | |
| Published online | 09 March 2015 | |
Research Note
Photodesorption of H2O, HDO, and D2O ice and its impact on fractionation⋆,⋆⋆
1 Gorlaeus Laboratories, Leiden Institute of Chemistry, Leiden University, PO Box 9502, 2300 RA Leiden, The Netherlands
2 Leiden Observatory, Leiden University, PO Box 9513, 2300 RA Leiden, The Netherlands
e-mail: This email address is being protected from spambots. You need JavaScript enabled to view it.
3 Max Planck Institute for Extraterrestrial Physics, Giessenbachstrasse 1, 85748 Garching, Germany
Received: 17 September 2013
Accepted: 16 December 2014
Abstract
The HDO/H2O ratio measured in interstellar gas is often used to draw conclusions on the formation and evolution of water in star-forming regions and, by comparison with cometary data, on the origin of water on Earth. In cold cores and in the outer regions of protoplanetary disks, an important source of gas-phase water comes from photodesorption of water ice. This research note presents fitting formulae for implementation in astrochemical models using previously computed photodesorption efficiencies for all water ice isotopologues obtained with classical molecular dynamics simulations. The results are used to investigate to what extent the gas-phase HDO/H2O ratio reflects that present in the ice or whether fractionation can occur during the photodesorption process. Probabilities for the top four monolayers are presented for photodesorption of X (X = H, D) atoms, OX radicals, and X2O and HDO molecules following photodissociation of H2O, D2O, and HDO in H2O amorphous ice at ice temperatures from 10−100 K. Significant isotope effects are found for all possible products: (1) H atom photodesorption probabilities from H2O ice are larger than those for D atom photodesorption from D2O ice by a factor of 1.1; the ratio of H and D photodesorbed upon HDO photodissociation is a factor of 2. This process will enrich the ice in deuterium atoms over time; (2) the OD/OH photodesorption ratio upon D2O and H2O photodissociation is on average a factor of 2, but the OD/OH photodesorption ratio upon HDO photodissociation is almost constant at unity for all ice temperatures; (3) D atoms are more effective in kicking out neighbouring water molecules than H atoms. However, the ratio of the photodesorbed HDO and H2O molecules is equal to the HDO/H2O ratio in the ice, therefore, there is no isotope fractionation when HDO and H2O photodesorb from the ice. Nevertheless, the enrichment of the ice in D atoms due to photodesorption can over time lead to an enhanced HDO/H2O ratio in the ice, and, when photodesorbed, also in the gas. The extent to which the ortho/para ratio of H2O can be modified by the photodesorption process is discussed briefly as well.
Key words: astrochemistry / molecular processes / ISM: molecules / solid state: volatile
Appendices are available in electronic form at http://www.aanda.org
Compiled simulation data and raw data are only available at the CDS via anonymous ftp to cdsarc.u-strasbg.fr (130.79.128.5) or via http://cdsarc.u-strasbg.fr/viz-bin/qcat?J/A+A/575/A121
© ESO, 2015
1. Introduction
The abundance of water in interstellar clouds, its partitioning between gas and ice, and its evolution from collapsing cores to protoplanetary disks are topics that are directly relevant for the formation of planets and their atmospheres. Astronomers can study the water trail starting either from the very first stages of dense molecular clouds even before a star is born (Whittet et al. 1988; Boogert et al. 2008; Caselli et al. 2012) or working backwards from the oceans on our own planet Earth, trying to link its composition to that of icy solar system bodies (e.g., Nuth 2008; Mumma & Charnley 2011, and see summary in van Dishoeck et al. 2014). In both approaches, the HDO/H2O ratio is thought to be a good indicator of the relevant processes involving water. Specifically, the fact that the HDO/H2O abundance of 3.1 × 10⁻⁴ in Earth’s oceans (de Laeter et al. 2003) is a factor of 2 lower than that found in most comets (Villanueva et al. 2009) has been used as an argument that most water on Earth originates from impact of asteroids rather than comets (Raymond et al. 2004)1. Recent observations with the Herschel Space Observatory have found at least two comets for which the HDO/H2O ratio is nearly the same as that in Earth’s oceans, demonstrating that there is a population of icy bodies with similar values (Hartogh et al. 2011; Bockelée-Morvan et al. 2012). However, “hot off the press” data from the Rosetta mission to comet 67 P/Churyumov-Gerasimenko now suggest that the HDO/H2O in Jupiter family objects has a wider range than heretofore assumed triggering further debate on the origin of Earth’s water (Altwegg et al. 2014). Hence, there is increased interest in understanding what processes affect the HDO/H2O ratio from core to disk to icy planetary bodies.
Physical-chemical models of the collapse of interstellar clouds and disk formation suggest that the bulk of water is formed on grains in the dense pre-collapse stage and enters the disk as ice that is largely unaltered since its formation (e.g., Aikawa & Herbst 1999; Visser et al. 2009). If so, the HDO/H2O ratio in the disk (and eventually in the planetesimals and planets that formed from it) should reflect the ice values found in the interstellar cloud from which the star formed. Recent simulations of deuterium chemistry in protoplanetary disks show that, in the absence of strong vertical mixing, a high initial HDO/H2O ratio is required in the ice to reproduce the values seen in solar system bodies (Furuya et al. 2013; Albertsson et al. 2014; Cleeves et al. 2014). In cold clouds prior to star formation and in the cold outer envelopes of low-mass protostars (T< 20 K), high ratios of deuterated species up to a few × 10-2 have been found for many molecules including water (e.g., van Dishoeck et al. 1995; Ceccarelli et al. 1998; Bacmann et al. 2003; Parise et al. 2004, 2012; and see review by Ceccarelli et al. 2014). Although the fractionation of HDO is generally not as high as that of other molecules, values of HDO/H2O up to a few % have been inferred in cold gas (Liu et al. 2011; Coutens et al. 2012), higher than those found in comets. They are also high compared with the upper limits on HDO/H2O measured directly in interstellar ices of < (1 − 5) × 10-3 (Dartois et al. 2003; Parise et al. 2003). Moreover, the HDO/H2O ratio in warm gas (> 100 K) near protostars typically has lower values of ~ 10-3, within a factor of a few of those of comets (e.g., Gensheimer et al. 1996; van der Tak et al. 2006; Jørgensen & van Dishoeck 2010b; Persson et al. 2014; Emprechtinger et al. 2013; Neill et al. 2013; Coutens et al. 2014a,b). These differences raise the question whether the high HDO/H2O values measured in cold gas reflect the HDO/H2O value in the ice or whether they have been altered by desorption processes.
In cold clouds, the bulk of the water is present as ice with only a small fraction of water in the gas, typically 10-4 of that of ice (e.g., Boonman & van Dishoeck 2003; Caselli et al. 2012). The water ice is formed in an early stage of cloud formation once the density and extinction reach a threshold (Cuppen & Herbst 2007). Temperatures in these regions are too low for thermal sublimation of ice, so the observed cold gas-phase water must come from non-thermal desorption processes of water ice with photodesorption a leading candidate (Hollenbach et al. 2009; Öberg et al. 2009). Indeed, both in pre-stellar cores (Caselli et al. 2012), in the outer parts of protostellar envelopes (Mottram et al. 2013; Schmalzl et al. 2014), and in the cold outer parts of disks (Dominik et al. 2005; Hogerheijde et al. 2011), the small observed gas-phase water amount is consistent with being due just to the photodesorption of water ice. The required UV photons are provided by the general interstellar radiation field at the outside of the cloud or by the star in the case of a protoplanetary disk, and by the interaction of cosmic rays with H2 deeper inside the cloud. Other non-thermal processes such as chemical desorption are poorly quantified but unlikely to be significant for thick layers of water ice (Dulieu et al. 2013; Minissale & Dulieu 2014). Chemical models have so far considered mostly deuterium fractionation processes in the gas phase or on the grains, but not during the (photo)desorption process (e.g., Tielens 1983; Aikawa & Herbst 1999; Roberts et al. 2003; Cazaux et al. 2011; Du et al. 2012; Aikawa et al. 2012; Taquet et al. 2013 and see summary in van Dishoeck et al. 2013).
In this paper, we use previously computed photodesorption probabilities to investigate the extent to which the photodesorption process can modify the gas-phase HDO/H2O ratio compared with that of the ices. Experiments have demonstrated that the water photodesorption yield is typically 10-3 per incident photon, but those data did not have the accuracy to establish differences between H2O and its isotopologues (Westley et al. 1995; Öberg et al. 2009). Photodesorption can also be quantified by molecular dynamics simulations. In a series of papers, both the photodesorption mechanisms and yields have been investigated for various water isotopologues and for different ice temperatures (Andersson et al. 2006; Andersson & van Dishoeck 2008; Arasa et al. 2010, 2011; Koning et al. 2013). The incident UV photon is absorbed by a water molecule in the ice, which dissociates into H + OH, with both fragments having excess energy. The outcome depends on the ice layer in which the UV photon is absorbed; only the top layers actively participate in desorption. Intact water molecules are released to the gas with a yield of ~ 5 × 10⁻⁴ per incident photon through two processes: (i) recombination of the H + OH fragments followed by escape of the energetic newly formed water molecule; and (ii) kick-out of a neighbouring water molecule by the energetic H atom produced by photodissociation. In contrast with molecules such as CO, the excited water molecule does not directly desorb since all UV absorptions immediately lead to dissociation of the molecule. Koning et al. (2013) have investigated the yields for the various processes using all combinations of water and its isotopologues, i.e., HDO and D2O in H2O ice but also H2O in D2O ice. Isotope-selective effects are found for the various combinations because of the different masses of the fragments. For example, if a D atom is created upon photodissociation, it is more effective in kicking out a neighbouring molecule than an H atom because of more efficient momentum transfer.
We here summarise the calculated photodesorption efficiencies as a function of ice layer and ice temperature for the astronomically relevant cases of H2O, HDO, and D2O in H2O ice, and we provide convenient fitting formulae with depth into the ice for use in astrochemical models. Subsequently the isotope-selective effects are quantified. Specifically, the more effective desorption of atomic H compared with atomic D will result in enrichment of D in the ice. Furthermore, the extent to which the photodesorption process can affect the ortho/para ratio of H2O in the gas is briefly discussed. Section 2 briefly summarises the computational methods that were used in previous papers. Section 3 lists the results for the isotope selective processes for each ice layer at ice temperatures from 10−90 K. Section 4 summarises the conclusions and astrophysical implications.
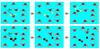 |
Fig. 1 Top: a H2O molecule (with H atoms in yellow) surrounded by water molecules absorbs an UV photon and dissociates into H and OH. H and OH recombine to form H2O that eventually desorbs from the ice surface via the direct mechanism. Bottom: a D2O molecule (with D atoms in black) surrounded by water molecules absorbs an UV photon and dissociates into D and OD. The heavier D atom transfers its momentum to one of the surrounding H2O molecules that desorbs from the ice via the “kick-out” mechanism. |
2. Methods
Our methods have been explained in detail in our previous studies (Andersson et al. 2006; Andersson & van Dishoeck 2008; Arasa et al. 2010, 2011; Koning et al. 2013), and are based on classical Molecular Dynamics (MD) methods (Allen & Tildesley 1987), in which the atoms and molecules in water ice move according to Newton’s equations based on analytical potentials of the interactions. In brief, an amorphous ice consisting of 480 water molecules is built for a certain ice temperature, and one water molecule (X2O (X = H or D) or HDO) is then randomly selected to be dissociated by UV radiation. Our previous studies show that only the photoexcited molecules that are initially located in the top four monolayers lead to photodesorption processes.
The dynamics of the photodissociation fragments are subsequently followed in the ice over a timescale of a few picoseconds until one of six possible outcomes is reached (see Fig. 1): (1) X atom desorption while OX stays trapped in the ice; (2) OX radical desorption while X stays trapped in the ice; (3) both X and OX desorb; (4) trapping of both X and OX photofragments; (5) recombination of the X atom and the OX radical to form X2O which in the end desorbs; or (6) stays trapped in the ice. When HDO is dissociated the outcome channels are the same, but the recombination of the photofragments leads to HDO that either desorbs (5), or stays trapped in the ice (6). Moreover, there is a parallel outcome to any of the 6 processes by which one of the surrounding H2O molecules from the ice can also desorb, initiated by the same UV photon. This mechanism is called “kick-out” (Andersson et al. 2006; Andersson & van Dishoeck 2008), and it takes place when the energetic X atom produced by photodissociation kicks a surrounding molecule from the ice by transfer of its momentum, and eventually the kicked out H2O molecule desorbs from the ice.
The calculations are repeated ≥6000 times per species and per monolayer so that the statistics (i.e., probabilities) of the different outcomes are determined as a function of the initial position of the molecule in the ice. The water molecules are excited with UV radiation in the 7.5−9.5 eV (1650−1300 Å) range, corresponding to the first electronic absorption band of water ice. Throughout the paper, ∗ indicates the molecule that is photodissociated in the ice. For the case of HDO∗ there are two possible outcomes: HOD∗ indicates photodissociation to H + OD whereas DOH∗ denotes dissociation to D + OH; HDO and HDO∗ denote the generic case.
In our previous studies (Arasa et al. 2010, 2011) we calculated the total photodesorption yields of OX and X2O per incident photon, and compared the results with the available experimental data (Öberg et al. 2009). For our model D2O ice, the photodesorption yield agrees well with the experimental photodesorption yield at low ice temperatures within the ~60% experimental uncertainties (Arasa et al. 2011). At higher ice temperatures, the experimental photodesorption yield is larger than the calculated value due to long timescale thermal effects that cannot be considered in our simulations. The experimental OX/H2O ratio is however on average a factor of 2 to 3 lower than the calculated value for H2O ice (see Table II in Arasa et al. 2010), and D2O ice, respectively. In a different kind of experiment, Yabushita et al. (2009) measured the final translational and rotational energies of the kicked out H2O molecules for υ = 0 at Tice = 90 K; their values match well with our calculated ones at Tice = 90 K and provide proof for the importance of the kick-out mechanism (Arasa et al. 2010). These comparisons between models and data provide confidence in the accuracy of our simulations. For isotope selective processes, only relative trends are considered, which should have less uncertainty than the absolute values.
3. Results and discussion
In this section we summarize the probabilities of all the photodesorption events after H2O∗, HDO∗ and D2O∗ photodissociation in amorphous H2O ice at relevant temperatures, Tice = 10 and 90 K. The supplementary material contains the probabilities at Tice = 20, 30, and 60 K for the top four monolayers (ML) of the ice surface. These results have been reported and extensively discussed elsewhere (Koning et al. 2013), but they are presented here in tabulated form for each of the top four monolayers so that the data can be used in astrochemical models. In addition, we provide fitting formulae to these tables in Table 1 (see Appendix B for more details)2.
A total of 6000 trajectories per monolayer have been simulated for photoexcitation of H2O and D2O. For photoexcitation of HDO, ≥6000 trajectories were run per monolayer. The photodesorption probabilities are calculated for each event as pi = Ni/Ntotal, i = photodesorption event, Ni = number of trajectories that lead to the photodesorption event i, Ntotal = total number of trajectories per monolayer j, the average is taken over the top four monolayers (e.g.,  ). All the probabilities are given per absorbed (rather than incident) UV photon. The averaged photodesorption probabilities calculated per incident UV photon are on average a factor of ~0.03 smaller than those given per absorbed UV photon for processes (1), (2), (3) and (5) (see numbering of outcomes in Sect. 2 of this paper and the description in Arasa et al. 2010, 2011).
Above 100 K, thermal desorption takes over as the main desorption mechanism in interstellar space, so our results are not relevant for the interpretation of data on warm water.
Fitting functions and best-fit values of the parameters a, b, c, and ML, ML being the number of the monolayer.
3.1. X (X = H, D) atom photodesorption probabilities
The X atom photodesorption event is the dominant process when the X2O photodissociated molecule is located in the top four monolayers of the ice surface (see Table 2 and Andersson et al. 2006; Andersson & van Dishoeck 2008). The X atom photodesorption probabilities are >90% in the top monolayer (ML1) and decrease with depth to ~30% in ML4 because in the top MLs the X atoms can easily find their way to escape from the surface, whereas deeper in the ice there are other molecules that prevent their desorption.
In general, H atom photodesorption probabilities are somewhat larger following H2O dissociation than those for D atom photodesorption after D2O photodissociation in H2O ice, especially if initially the molecules are located in the third and fourth monolayers. The same trend is observed after HOD∗/DOH∗ photodissociation in H2O ice: H atom photodesorption probabilities are larger than those for the D atom. This is because of isotope mass effects: the H atom is lighter than the D atom and therefore transfers less energy to nearby water molecules, so that it can travel more easily from the bottom to the top of the surface and eventually desorb to the gas phase (Arasa et al. 2011; Koning et al. 2013).
The average H/D photodesorption ratios following H2O∗ and D2O∗ photodissociation and the average H/D ratios following HDO∗ photodissociation over the top four MLs are summarized in Table 3 versus ice temperature. The photodesorption ratio  after HDO photodissociation have been calculated (as was done for the photodesorption
  in Table IV in Koning et al. 2013) taking into account the probabilities in each ML, i, where PDdes(i,Tice) is the D photodesorption probability after DOH∗ photodissociation into D and OH, and PHdes(i,Tice) is the H photodesorption probability after HOD∗ photodissociation into H and OD), and the branching ratios (
 ) in the ice in each ML, i, and temperature (β(i, Tice)). The effect is typically a factor of 1.1 when comparing H2O and D2O, and when comparing HOD in H2O and DOH in H2O.
For HDO∗ photodissociation, there is another effect at work, namely that the probability of dissociation into H + OD is larger than that into D + OH, a process that is well known in the gas phase. For gas-phase photodissociation, the OD/OH branching ratio is about 3.1 (van Harrevelt & van Hemert 2012, priv. comm. regarding unpublished data in Table I in van Harrevelt & van Hemert 2001). In the ice, this effect is less, but still at the factor of two level. The HDO∗ photodissociation branching ratios () in the ice in each ML, i, and temperature (β(i, Tice)) were calculated and listed in Table IV in Koning et al. (2013). The average branching ratio taken over all ice temperatures is about 2.2 in favor of H + OD. Thus the branching ratio upon HDO photodissociation in the ice reinforces the H/D desorption ratio leading to a ratio more than a factor of two larger than the ratio of H and D present in the ice (calculated from Tables 2 and A.1). Therefore, all photons that arrive in the ice and are absorbed in the top layers of the ice surface lead to an enrichment in D atoms relative to H atoms in the ice mantles of dust particles.
X atom photodesorption probabilities at Tice = 10 K (top) and 90 K (bottom) resulting from photoexcitation of a X2O (X = H, D) or XOY (HOD or DOH) molecule present in a specific monolayer of H2O ice.
3.2. OX (X = H, D) radical photodesorption probabilities
The second most important photodesorption event is OX photodesorption with probabilities of typically a few % in the top layers. In Table 4 the OX radical photodesorption probabilities for the top four monolayers together with the average values taken over the top four MLs are summarised at Tice = 10 K and 90 K. It is seen that the photodesorption probabilities drop sharply from ML2 to ML3. This feature has been explained in detail previously (Andersson et al. 2006; Andersson & van Dishoeck 2008; Koning et al. 2013). Although OX is quite mobile in the top ice layer (ML1), it loses much of its energy in lower layers to other H2O molecules in the ice, preventing desorption of OX.
The OH photodesorption probabilities after DOH∗ photodissociation and OD photodesorption probabilities after D2O∗ photodissociation are larger than those for OD after HOD∗ photodissociation and OH after H2O∗ in H2O ice. This result is expected because the OD radicals have higher kinetic energies than the OH radicals upon the initial D2O and H2O photodissociation, respectively. In contrast, the OH radicals have higher kinetic energy than the OD radicals upon HDO∗ photodissociation. These findings follow from applying energy and momentum conservation (pOX + pX = 0, and EOX + EX = ΔE, with ΔE being the initial available energy; ΔE = Eexc − Ediss(X2O), see Arasa et al. 2011) . For X2O photodissociation at the same excitation energy Eexc it is seen that if EOX = ΔE/ (1 + mOX/mX), the initial energy of OD should be a factor 1.8 larger than that for OH. In the case of X(1)OX(2) photodissociation into OX(2) + X(1), and applying the same conservation rules we can expect that the energy of the OX(2) radical formed upon DOX(2) photodissociation is about a factor of two larger than the OX(2) radical formed upon HOX(2) photodissociation (see Table III in Koning et al. 2013).
Average photodesorption ratio following H2O∗, D2O∗ and HDO∗ photodissociation.
The average OD/OH photodesorption ratios following HDO∗ photodissociation over the top four MLs are summarised in Fig. 2. The photodesorption ratio ODdes/OHdes after HOD∗ and DOH∗ photodissociation have been calculated taking account the probabilities in each ML, i, where PODdes(i,Tice) is the OD photodesorption probability after HOD∗ photodissociation into H and OD, and POHdes(i,Tice) is the OH photodesorption probability after DOH∗ photodissociation into D and OH, and the photodissociation branching ratios H+OD/D+OH in the ice in each ML, i, and temperature (β(i, Tice), see Table IV in Koning et al. (2013). These values are seen to be close to unity and to be mostly constant with ice temperature. The reason that the ODdes/OHdes ratios are close to unity for HDO∗is that a cancellation of the two effects occurs. On the one hand, the OH desorption is more efficient than that of OD, as explained above. However, this is offset by the OD/OH branching ratio of about 2.2 in the HDO∗ photodissociation, as discussed in Sect. 3.1. As a result, the average photodesorption ratio ODdes/OHdes upon HDO∗ photodissociation is about 1.0 with a standard deviation of 0.2 in the ice (Koning et al. 2013). Note that this result is very different from pure gas-phase chemistry, where OD is produced a factor of three more rapidly than OH by photodissociation of gaseous HDO.
Figure 2 also contains the average photodesorption ratios between OD desorption following D2O photodissociation in H2O ice and OH desorption following H2O photodissociation in H2O ice for all ice temperatures considered. On average, the ODdes(D2O)/OHdes(H2O) ratio is about 1.9.
OX radical photodesorption probabilities at Tice = 10 K (top) and 90 K (bottom) resulting from photoexcitation of a X2O (X = H, D) or XOY (HOD or DOH) molecule present in a specific monolayer of H2O ice.
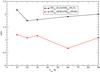 |
Fig. 2 ODdes(D2O)/OHdes(H2O) ratios and ODdes(HOD)/OHdes(DOH) ratios averaged over the top four monolayers following HDO dissociation in H2O ice versus ice temperature Tice (based on Koning et al. 2013). |
Total X2O (X = H, D) or XOY (HOD or DOH) photodesorption probabilities at Tice = 10 K (top) and 90 K (bottom) per monolayer due to the direct and the kick-out mechanism for X2O and XOY photodissociation in H2O ice.
3.3. X2O (X = H, D) and HDO molecule photodesorption probabilities
X2O photodesorption is the third most important photodesorption event after H2O∗ and D2O∗ photodissociation with probabilities of ~0.5% in the top layers. As discussed above, two processes can occur: direct desorption of the recombined H2O or D2O molecule or through the kick of the energetic X atom to a surrounding H2O molecule from the ice. When HOD∗ dissociates it can also lead to the recombination of the H and OD fragments that eventually desorb as HDO, or the H atom can kick out the surrounding H2O molecules from the ice. Similarly, when DOH∗ dissociates the photofragments can also recombine and desorb, or the D atom can kick out a H2O molecule. In Table 5 the probabilities of both mechanisms for the top four MLs and its average for the four different scenarios are reported at Tice = 10 K and 90 K. Again, isotope effects are rather noticeable if X2O desorbs from the ice surface through the kick-out mechanism (Koning et al. 2013) after the X atom transfers its momentum to the surrounding H2O molecules. Since the D atom is heavier than the H atom it can transfer its momentum more easily to a surrounding H2O molecule, leading to higher kick-out photodesorption probabilities, and in consequence to higher total X2O and HOD photodesorption probabilities (Arasa et al. 2011; Koning et al. 2013). As demonstrated in Appendix C, this process does however not lead to fractionation of HDO/H2O in the gas in H2O-dominated ices, i.e., the gas-phase HDO/H2O ratio produced by photodesorption reflects that originally in the ice.
3.4. Ortho/para ratio of photodesorbed H2O
Observations of water in space also provide constraints on the ortho/para ratio of water in the gas. In diffuse interstellar clouds and high temperature shocks, these measurements are consistent with a ratio of 3, as expected from gas phase formation of water (e.g., Flagey et al. 2013; Herczeg et al. 2012; Emprechtinger et al. 2013). In contrast, the ortho/para ratio of water in protoplanetary disks and in photon-dominated regions, such as the Orion Bar, is found to be much lower, with values < 1 (Hogerheijde et al. 2011; Choi et al. 2014). In these regions, the water results from photodesorption of water ice, not from thermal sublimation as is the case for comets (Mumma & Charnley 2011). The question therefore arises to what extent the process of photodesorption preserves the ortho/para ratio that was present in the ice.
In the direct photodesorption mechanism, the H-OH bond is broken and then reformed, so the ortho/para ratio is basically reset to the statistical value of 3. For the kick-out mechanism, however, the original ortho/para ratio in the ice should be preserved. The relative importance of the direct and kick-out mechanisms depends on the ice monolayer and to a lesser extent on the ice temperature. Table 5 summarises the average values over the first four monolayers of the two options. It is seen that the direct mechanism is typically a factor 1.3 more efficient than the kick-out mechanism for H2O. Thus, if the ortho/para ratio in the ice were low, say ≤ 0.5, the gas-phase ortho/para ratio of the photodesorbed H2O would be significantly higher, at least 2, due to the photodesorption process.
Low ortho/para ratios in the ice could occur if the ratio had equilibrated to the grain temperature of typically 10−30 K, a process that in itself is still poorly understood (e.g., Dulieu 2011). The main message here is that due to the partial reset during the photodesorption process, the observed gaseous ortho/para ratio only partially reflects the original ice ratio.
4. Conclusions
This paper has investigated the deuterium fractionation that can occur when OD, HDO or D2O molecules are liberated from a H2O-rich ice following a photodesorption event at a microscopic level. The results presented in Sect. 3 lead to the following conclusions:
-
1.
No isotope fractionation occurs in the photodesorption of HDOand H2O from a mixed ice, even though kick-out by D is moreefficient. The ratio of photodesorbed HDO and H2O is equal to theratio of HDO and H2O in the ice.
-
2.
No isotope fractionation occurs in the photodesorption of OD and OH upon HDO photodissociation in H2O ice. The ratio of photodesorbed OD and OH is equal to the HDO/H2O ratio in the ice within 20%.
-
3.
The ratio of photodesorbed H and D will be more than twice the ratio of H and D present in the ice in HDO and H2O, because photo-excitation of HDO leads preferentially to desorption of H. Therefore, given enough time and enough photons photoprocessing of the outer layers of icy mantles could lead to enrichment in D relative to H.
A possible mechanism for an increased ratio of HDO/H2O in the gas phase compared with that initially in the ice may therefore be prolonged photoprocessing of the outer layers of icy mantles of dust particles. Photo-excitation of HDO leads preferentially to desorption of H. As a consequence, the ratio of photodesorbed H and D will be greater than twice the ratio of H and D present in the ice. If photoprocessing occurs over a long enough time, the outer layers will develop a larger fraction of D, and, through grain surface reactions of D with OH, therefore also of HDO. So ultimately, the ratio of photodesorbed HDO and H2O can become enhanced due to this indirect process. Full gas-grain models that take the multi-layer structure of the ice into account are needed to investigate whether this is a plausible mechanism for isotope fractionation of HDO, since pure gas-phase processes can also lead to fractionation (e.g., Aikawa et al. 2012). If it is, then the relative abundance of HDO may also reflect the total fluence of UV radiation (product of UV flux and time) that the outer layers of icy mantles have been exposed to in the environment where they are observed.
Finally, we note that the ortho/para ratio of water in the gas does not directly reflect that in the ice but is partially reset by the photodesorption process.
Online material
Appendix A: Auxiliary tables
Tables A.1−A.3 contain the probabilities for X atom desorption, OX desorption, and X2O and HDO desorption (X = H, D), respectively, at Tice = 20, 30, and 60 K.
X atom photodesorption probabilities at Tice = 20 K, 30 K, and 60 K resulting from photoexcitation of a X2O (X = H, D) or XOY (HOD or DOH) molecule present in a specific monolayer of H2O ice.
OX radical photodesorption probabilities at Tice = 20 K, 30 K, and 60 K resulting from photoexcitation of a X2O (X = H, D) or XOY (HOD or DOH) molecule present in a specific monolayer of H2O ice.
Total X2O (X = H, D) or XOY (HOD or DOH) photodesorption probabilities at Tice = 20 K, 30 K, and 60 K per monolayer due to the direct and the kick-out mechanism for X2O and XOY photodissociation in H2O ice.
Appendix B: Fitting formulae for photodesorption probabilities
Tables 2, 4, 5, A.1−A.3 list the total probabilities for X desorption, OX desorption, and X2O and HDO desorption (X = H, D) following a dissociation event, as a function of both monolayer and ice temperature. These tables also give the average probabilities, over the top four monolayers, for each species. For use in astrochemical models, it is useful to know the probability (per monolayer) of every potential outcome, rather than the total probability for the desorption of each species. This is because, in full gas-grain models, one is also interested in the composition of the ice mantle, as well as the gas.
As discussed in the main body of this paper, there are six potential outcomes following a dissociation event which can lead to a change in composition of both the ice and gas. For example, for HDO which is dissociated into H + OD, 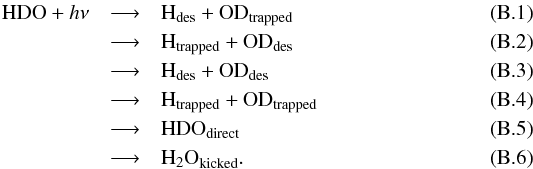 Equation (B.6) is the process known as “kick out” whereby a neighbouring H2O is ejected from the ice via momentum transfer from an excited photofragment. The probabilities of each of these events as a function of monolayer and ice temperature have been compiled from the raw data of the molecular dynamics simulations and are available at the CDS. There is a seventh possibility in which the photofragments recombine to reform HDO which remains trapped in the ice. This process does not change the gas or ice composition and thus we have not listed the probabilities for this outcome here; however, these data are necessary if one is interested in extrapolating the probabilities to deeper monolayers, ML > 4.
To determine the desorption probabilities at temperatures and in monolayers outside of those tabulated, one can simply interpolate/extrapolate using, for example, cubic spline interpolation. However, when extrapolating to determine probabilities for deeper monolayers, ML > 4, one should take care to ensure that, deep into the ice mantle, the probabilities for outcomes (B.1), (B.2), (B.3), (B.5), and (B.6) tend to 0, and the probability for outcome (B.4) tends to 1 − Precom, where Precom is the probability that the photofragments recombine to reform the molecule (which remains trapped in the ice). Deeper into the ice, desorption events become increasingly less probable and the most probable outcome becomes trapping of the photofragments (or the reformed molecule, following recombination). In addition, at very low coverage, ML < 1, the rates for all outcomes should tend to 0 as ML → 0.
In Table 1 we present our fitting functions and corresponding best-fit parameters for the temperature-averaged probabilities per monolayer for each outcome. The probabities are well fitted using a Gaussian-like function with the exception of the outcomes leading to trapping of the OY radical for which an exponential-like function was found to be more appropriate for describing the asymptotic behaviour of the probabilities towards deeper monolayers (≫4). In Fig. B.1 we present the probability per monolayer at each temperature and the temperature-averaged probabilities per monolayer along with the fitted functions for the example of DOH∗. The probabilities were fitted using the non-linear least-squares (NLLS) Marquardt-Levenberg algorithm (Marquardt 1963). The probabilities are a much stronger function of monolayer than temperature; hence, our decision to fit functions with respect to monolayer only.
For implementation in chemical models which adopt the rate equation method for describing the ice chemistry and gas-grain balance, the probabilities per monolayer should be multiplied by the rate of arrival of UV photons in the wavelength range 1650−1300 Å onto the grain surface times the absorption cross section of a UV photon by a grain-surface site (or molecule, in this case, HDO). The total desorption rate is then determined by integrating the desorption rate per monolayer over the total number of monolayers on the grain. The probabilities can be directly employed in stochastic chemical models in which the discrete nature of chemical reactions are taken into account (see, e.g. Cuppen & Herbst 2007).
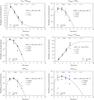 |
Fig. B.1 Temperature-specific probabilities, temperature-averaged probabilities, and fitted functions for each outcome as a function monolayer for HDO photodissociation into D + OH. |
Appendix C: Photodesorption and fractionation
This section investigates whether photodesorption ultimately also leads to fractionation of HDO/H2O in the gas. We can estimate the total photodesorption probability ratio between HDO and H2O by taking into account the direct and kicked out mechanism in both cases. The probability of HDO photodesorption through the direct mechanism is given by 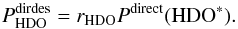 (C.1)In Eq. (C.1), Pdirect( HDO∗) is the probability that upon photo-excitation of HDO (the generic case) the HDO recombines and desorbs directly. It can be approximately calculated using
 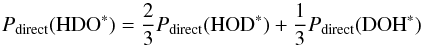 (C.2)and rHDO is the original HDO/H2O ratio in the ice (of the order of 0.01 or less as indicated by observations). In Eq. (C.2), the probabilities on the right hand side are the probabilities for the direct mechanism for photodesorbing HDO averaged over the top four monolayers and presented in Tables 5 and A.3.
The probability of H2O photodesorption through the direct mechanism is given by 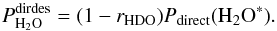 (C.3)In Eq. (C.3), Pdirect(H2O∗) is the probability that upon photo-excitation H2O recombines and desorbs directly. It can be obtained directly from Tables 5 and A.3.
As can be seen from Table 2 and after using Eq. (C.2), Pdirect(HDO∗) and Pdirect(H2O∗) are roughly the same. As a result  (C.4)meaning that there is no isotope fractionation due to the direct mechanism.
Now consider the kick-out mechanism. The indirect probabilities can be written as follows: 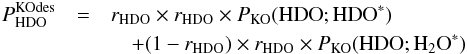 (C.5)and
 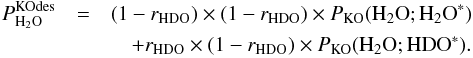 (C.6)In Eqs. (C.5) and (C.6),
  is the probability of desorption of HXO through the kick-out mechanism, where X is either H or D. Furthermore, PKO(HX1O; HX2O∗) is the probability that HX1O is kicked out after photo-excitation of HX2O, where X1 can either be H or D, and X2 can also be H or D. As for the direct mechanism, we can approximately calculate PKO(HX1O;HX2O∗) from
 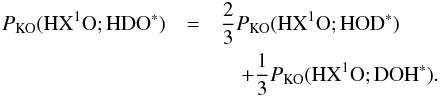 (C.7)The two quantities on the right hand side of Eq. (C.7) have been tabulated for X1 equal to H in Tables 5 and A.3.
Because we have only calculated probabilities that H2O is kicked out, we make the following approximations, ![Mathematical equation: \appendix \setcounter{section}{3} \begin{eqnarray} \label{eq:GJ8} P_\mathrm{KO}( {\rm HDO};{\rm HOD}^*) &=& P_\mathrm{KO}({{\rm H}_2{\rm O}};{\rm HOD}^*) \\[1mm] \label{eq:GJ9} P_\mathrm{KO}( {\rm HDO};{\rm DOH}^*) &=& P_\mathrm{KO}({{\rm H}_2{\rm O}};{\rm DOH}^*) \\[1mm] \label{eq:GJ10} P_\mathrm{KO}( {\rm HDO}; {\rm HDO}^*) &=& P_\mathrm{KO}({{\rm H}_2{\rm O}}; {\rm HDO}^*). \end{eqnarray}](/articles/aa/full_html/2015/03/aa22695-13/aa22695-13-eq88.png) The right hand values of Eqs. (C.8) and (C.9) can be directly obtained from Tables 5 and A.3. PKO( HDO; HDO∗) can be computed using the approximation in Eq. (C.10) and using Eq. (C.7) and Tables 5 and A.3.
The right hand values of Eqs. (C.8) and (C.9) can be directly obtained from Tables 5 and A.3. PKO( HDO; HDO∗) can be computed using the approximation in Eq. (C.10) and using Eq. (C.7) and Tables 5 and A.3.
Using Eqs. (C.8)–(C.10), Eq. (C.5) can be rewritten as ![Mathematical equation: \appendix \setcounter{section}{3} \begin{eqnarray} P^\mathrm{KOdes}_ {\rm HDO} & \approx& r_ {\rm HDO} \times r_ {\rm HDO} \times P_\mathrm{KO}({{\rm H}_2{\rm O}}; {\rm HDO}^*) \nonumber\\[1mm] && \quad + (1 - r_ {\rm HDO}) \times r_ {\rm HDO} \times P_\mathrm{KO}({{\rm H}_2{\rm O}};{{\rm H}_2{\rm O}}^*). \label{eq:GJ12} \end{eqnarray}](/articles/aa/full_html/2015/03/aa22695-13/aa22695-13-eq89.png) (C.11)Most importantly, for 10 and 20 K we have approximately that (see Tables 5 and A.3)
(C.11)Most importantly, for 10 and 20 K we have approximately that (see Tables 5 and A.3)  (C.12)
Inserting Eq. (C.12) in Eq. (C.11) yields 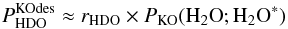 (C.13)and inserting Eq. (C.12) in Eq. (C.6) yields
  (C.14)From Eqs. (C.13) and (C.14), we can derive that
 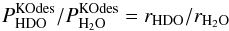 (C.15)meaning that there should be no isotope fractionation due to the indirect kick-out mechanism. Taken together, Eqs. (C.4) and (C.15) ensure that the ratio of desorbed HDO over desorbed H2O in the ice is given by
  (C.16)which means that this ratio is simply equal to the ratio of HDO and H2O in the ice. Therefore, isotope fractionation does not occur for HDO and H2O photodesorption.
The measured HDO/H2O ratio is 2 × (D/H) in water; the latter values are commonly used in the literature.
All tables can be downloaded from http://www.strw.leidenuniv.nl/~ewine/photo
Acknowledgments
The authors are grateful to M. C. van Hemert for discussions on the setup of the Wigner distributions and the data for the gas-phase partial absorption spectra of HDO, and to S. Andersson for providing the initial MD photodissociation code. This project was funded by NWO astrochemistry grant No. 648.000.010 and from the European Union A-ERC grant 291141 CHEMPLAN.
References
- Aikawa, Y., & Herbst, E. 1999, ApJ, 526, 314 [NASA ADS] [CrossRef] [MathSciNet] [Google Scholar]
- Aikawa, Y., Wakelam, V., Hersant, F., Garrod, R. T., & Herbst, E. 2012, ApJ, 760, 40 [NASA ADS] [CrossRef] [Google Scholar]
- Albertsson, T., Semenov, D., & Henning, Th. 2014, ApJ, 784, 39 [NASA ADS] [CrossRef] [Google Scholar]
- Allen, M. P., & Tildesley, D. J. 1987, Computer Simulations of Liquids (Oxford: Clarendon) [Google Scholar]
- Altwegg, K., Balsiger, H., Bar-Nun, A., et al. 2014, Science, 347, 6220 [Google Scholar]
- Andersson, S., Al-Halabi, A., Kroes, G. J., & van Dishoeck, E. F. 2006, J. Chem. Phys., 124, 064715 [NASA ADS] [CrossRef] [Google Scholar]
- Andersson, S., & van Dishoeck, E. F. 2008, A&A, 491, 907 [NASA ADS] [CrossRef] [EDP Sciences] [Google Scholar]
- Arasa, C., Andersson, S., Cuppen, H. M., van Dishoeck, E. F., & Kroes, G. J. 2010, J. Chem. Phys., 132, 184510 [NASA ADS] [CrossRef] [Google Scholar]
- Arasa, C., Andersson, S., Cuppen, H. M., van Dishoeck, E. F., & Kroes, G. J. 2011, J. Chem. Phys., 134, 164503 [NASA ADS] [CrossRef] [Google Scholar]
- Bacmann, A., Lefloch, B., Ceccarelli, C., et al. 2003, ApJ, 585, L55 [NASA ADS] [CrossRef] [EDP Sciences] [Google Scholar]
- Bockelée-Morvan, D., Biver, N., Swinyard, B., et al. 2012, A&A, 544, L15 [NASA ADS] [CrossRef] [EDP Sciences] [Google Scholar]
- Boogert, A. C. A., Pontoppidan, K. M., Knez, C., et al. 2008, ApJ, 678, 985 [NASA ADS] [CrossRef] [Google Scholar]
- Boonman, A. M. S., & van Dishoeck, E. F. 2003, A&A, 403, 1003 [Google Scholar]
- Caselli, P., Keto, E., Bergin, E. A., et al. 2012, ApJ, 759, L37 [Google Scholar]
- Cazaux, S., Caselli, P., & Spaans, M. 2011, ApJ, 741, L34 [NASA ADS] [CrossRef] [Google Scholar]
- Ceccarelli, C., Castets, A., Loinard, L., Caux, E., & Tielens, A. G. G. M. 1998, A&A, 338, L43 [NASA ADS] [Google Scholar]
- Ceccarelli, C., Caselli, P., Bockelée-Morvan, D., et al. 2014, Protostars & Planets VI (Tucson: Univ. Arizona Press), 859 [Google Scholar]
- Choi, Y., van der Tak, F. F. S., Bergin, E. A., & Plume, R. 2014, A&A, 572, L10 [Google Scholar]
- Cleeves, L. I., Bergin, E. A., Alexander, C. M. O’D., et al. 2014, Science, 345, 1590 [NASA ADS] [CrossRef] [Google Scholar]
- Coutens, A., Vastel, C., Caux, E., et al. 2012, A&A, 539, A132 [NASA ADS] [CrossRef] [EDP Sciences] [Google Scholar]
- Coutens, A., Jørgensen, J. K., Persson, M. V., et al. 2014a, ApJ, 792, L5 [NASA ADS] [CrossRef] [Google Scholar]
- Coutens, A., Vastel, C., Hincelin, U., et al. 2014b, MNRAS, 445, 1299 [NASA ADS] [CrossRef] [Google Scholar]
- Cuppen, H. M., & Herbst, E. 2007, ApJ, 668, 294 [Google Scholar]
- Dartois, E., Thi, W.-F., Geballe, T. R., et al. 2003, A&A, 399, 1009 [NASA ADS] [CrossRef] [EDP Sciences] [Google Scholar]
- de Laeter, J. R., Böhlke, J. K., De Bièvre, P., et al. 2003, Pure and Applied Chemistry, 75, 683 [CrossRef] [Google Scholar]
- Dominik, C., Ceccarelli, C., Hollenbach, D., & Kaufman, M. 2005, ApJ, 635, L85 [NASA ADS] [CrossRef] [Google Scholar]
- Du, F., Parise, B., & Bergman, P. 2012, A&A, 544, C4 [NASA ADS] [CrossRef] [EDP Sciences] [Google Scholar]
- Dulieu, F. 2011, in IAU Symp., 280, 405 [Google Scholar]
- Dulieu, F., Congiu, E., Nobel, J., et al. 2013, Nature Sci. Rep., 3, 1338 [NASA ADS] [CrossRef] [Google Scholar]
- Emprechtinger, M., Lis, D. C., Rolffs, R., et al. 2013, ApJ, 765, 61 [NASA ADS] [CrossRef] [Google Scholar]
- Flagey, N., Goldsmith, P. F., Lis, D. C., et al. 2013, ApJ, 762, 11 [NASA ADS] [CrossRef] [Google Scholar]
- Furuya, K., Aikawa, Y., Nomura, H., Hersant, F., & Wakelam, V. 2013, ApJ, 779, 11 [NASA ADS] [CrossRef] [Google Scholar]
- Gensheimer, P. D., Mauersberger, R., & Wilson, T. L. 1996, A&A, 314, 281 [NASA ADS] [Google Scholar]
- Hartogh, P., Lis, D. C., Bockelée-Morvan, D., et al. 2011, Nature, 478, 218 [NASA ADS] [CrossRef] [PubMed] [Google Scholar]
- Herczeg, G. J., Karska, A., Bruderer, S., et al. 2012, A&A, 540, A84 [NASA ADS] [CrossRef] [EDP Sciences] [Google Scholar]
- Hogerheijde, M. R., Bergin, E. A., Brinch, C., et al. 2011, Science, 334, 338 [NASA ADS] [CrossRef] [PubMed] [Google Scholar]
- Hollenbach, D., Kaufman, M. J., Bergin, E. A., & Melnick, G. J. 2009, ApJ, 690, 1497 [CrossRef] [Google Scholar]
- Jørgensen, J. K., & van Dishoeck, E. F. 2010, ApJ, 725, L172 [NASA ADS] [CrossRef] [Google Scholar]
- Koning, J., Kroes, G. J., & Arasa, C. 2013, J. Chem. Phys., 138, 104701 [NASA ADS] [CrossRef] [Google Scholar]
- Liu, F.-C., Parise, B., Kristensen, L., et al. 2011, A&A, 527, A19 [NASA ADS] [CrossRef] [EDP Sciences] [Google Scholar]
- Marquardt, D. W. 1963, J. Soc. Ind. Appl. Math., 11, 431 [Google Scholar]
- Minissale, M, & Dulieu, F. 2014, J. Chem. Phys., 141, 14304 [Google Scholar]
- Mottram, J. C., van Dishoeck, E. F., Schmalzl, M., et al. 2013, A&A, 558, A126 [NASA ADS] [CrossRef] [EDP Sciences] [Google Scholar]
- Mumma, M. J., & Charnley, S. B. 2011, ARA&A, 49, 471 [NASA ADS] [CrossRef] [Google Scholar]
- Neill, J. L., Wang, S., Bergin, E. A., et al. 2013, ApJ, 770, 142 [NASA ADS] [CrossRef] [Google Scholar]
- Nuth, J. A. 2008, Earth, Moon and Planets, 102, 435 [Google Scholar]
- Öberg, K. I., Linnartz, H., Visser, R., & van Dishoeck, E. F. 2009, ApJ, 693, 1209 [NASA ADS] [CrossRef] [Google Scholar]
- Parise, B., Simon, T., Caux, E., et al., 2003, A&A, 410, 897 [NASA ADS] [CrossRef] [EDP Sciences] [Google Scholar]
- Parise, B., Castets, A., Herbst, E., et al. 2004, A&A, 416, 159 [NASA ADS] [CrossRef] [EDP Sciences] [Google Scholar]
- Parise, B., Du, F., Liu, F.-C., et al. 2012, A&A, 542, L5 [NASA ADS] [CrossRef] [EDP Sciences] [Google Scholar]
- Persson, M. V., Jørgensen, J. K., van Dishoeck, E. F., & Harsono, D. 2014, A&A, 563, A74 [NASA ADS] [CrossRef] [EDP Sciences] [Google Scholar]
- Raymond, S. N., Quinn, T., & Lunine, J. I. 2004, Icarus, 168, 1 [NASA ADS] [CrossRef] [MathSciNet] [Google Scholar]
- Roberts, H., Herbst, E., & Millar, T. J. 2003, ApJ, 591, L41 [NASA ADS] [CrossRef] [Google Scholar]
- Schmalzl, M., Visser, R., Walsh, C., et al. 2014, A&A, 572, A81 [NASA ADS] [CrossRef] [EDP Sciences] [Google Scholar]
- Taquet, V., Peters, P. S., Kahane, C., et al. 2013, A&A, 550, A127 [NASA ADS] [CrossRef] [EDP Sciences] [Google Scholar]
- Tielens, A. G. G. M. 1983, A&A, 119, 177 [NASA ADS] [Google Scholar]
- van der Tak, F. F. S., Walmsley, C. M., Herpin, F., & Ceccarelli, C. 2006, A&A, 447, 1011 [NASA ADS] [CrossRef] [EDP Sciences] [Google Scholar]
- van Dishoeck, E. F., Blake, G. A., Jansen, D. J., & Groesbeck, T. D. 1995, ApJ, 447, 760 [NASA ADS] [CrossRef] [Google Scholar]
- van Dishoeck, E. F., Herbst, E., & Neufeld, D. A. 2013, Chem. Rev., 113, 9043 [NASA ADS] [CrossRef] [PubMed] [Google Scholar]
- van Dishoeck, E. F., Bergin, E. A., Lis, D. C., & Lunine, J. I. 2014, Protostars & Planets VI (Tucson: Univ. Arizona Press), 835 [Google Scholar]
- van Harrevelt, R., & van Hemert, M. C. 2001, J. Chem. Phys., 114, 9453 [NASA ADS] [CrossRef] [Google Scholar]
- Villanueva, G. L., Mumma, M. J., Bonev, B. P., et al. 2009, ApJ, 690, L5 [NASA ADS] [CrossRef] [Google Scholar]
- Visser, R., van Dishoeck, E. F., Doty, S. D., & Dullemond, C. P. 2009, A&A, 495, 881 [NASA ADS] [CrossRef] [EDP Sciences] [Google Scholar]
- Westley, M. S., Baragiola, R. A., Johnson, R. E., & Baratta, G. A. 1995, Planet. Space Sci., 43, 1311 [NASA ADS] [CrossRef] [Google Scholar]
- Whittet, D. C. B., Bode, M. F., Longmore, A. J., et al. 1988, MNRAS, 233, 321 [NASA ADS] [CrossRef] [Google Scholar]
- Yabushita, A., Hama, T., Yokoyama, M., et al. 2009, ApJ, 699, L80 [NASA ADS] [CrossRef] [Google Scholar]
All Tables
Fitting functions and best-fit values of the parameters a, b, c, and ML, ML being the number of the monolayer.
X atom photodesorption probabilities at Tice = 10 K (top) and 90 K (bottom) resulting from photoexcitation of a X2O (X = H, D) or XOY (HOD or DOH) molecule present in a specific monolayer of H2O ice.
OX radical photodesorption probabilities at Tice = 10 K (top) and 90 K (bottom) resulting from photoexcitation of a X2O (X = H, D) or XOY (HOD or DOH) molecule present in a specific monolayer of H2O ice.
Total X2O (X = H, D) or XOY (HOD or DOH) photodesorption probabilities at Tice = 10 K (top) and 90 K (bottom) per monolayer due to the direct and the kick-out mechanism for X2O and XOY photodissociation in H2O ice.
X atom photodesorption probabilities at Tice = 20 K, 30 K, and 60 K resulting from photoexcitation of a X2O (X = H, D) or XOY (HOD or DOH) molecule present in a specific monolayer of H2O ice.
OX radical photodesorption probabilities at Tice = 20 K, 30 K, and 60 K resulting from photoexcitation of a X2O (X = H, D) or XOY (HOD or DOH) molecule present in a specific monolayer of H2O ice.
Total X2O (X = H, D) or XOY (HOD or DOH) photodesorption probabilities at Tice = 20 K, 30 K, and 60 K per monolayer due to the direct and the kick-out mechanism for X2O and XOY photodissociation in H2O ice.
All Figures
|
Fig. 1 Top: a H2O molecule (with H atoms in yellow) surrounded by water molecules absorbs an UV photon and dissociates into H and OH. H and OH recombine to form H2O that eventually desorbs from the ice surface via the direct mechanism. Bottom: a D2O molecule (with D atoms in black) surrounded by water molecules absorbs an UV photon and dissociates into D and OD. The heavier D atom transfers its momentum to one of the surrounding H2O molecules that desorbs from the ice via the “kick-out” mechanism. |
| In the text | |
|
Fig. 2 ODdes(D2O)/OHdes(H2O) ratios and ODdes(HOD)/OHdes(DOH) ratios averaged over the top four monolayers following HDO dissociation in H2O ice versus ice temperature Tice (based on Koning et al. 2013). |
| In the text | |
|
Fig. B.1 Temperature-specific probabilities, temperature-averaged probabilities, and fitted functions for each outcome as a function monolayer for HDO photodissociation into D + OH. |
| In the text | |
Current usage metrics show cumulative count of Article Views (full-text article views including HTML views, PDF and ePub downloads, according to the available data) and Abstracts Views on Vision4Press platform.
Data correspond to usage on the plateform after 2015. The current usage metrics is available 48-96 hours after online publication and is updated daily on week days.
Initial download of the metrics may take a while.