| Issue |
A&A
Volume 574, February 2015
|
|
|---|---|---|
| Article Number | A19 | |
| Number of page(s) | 10 | |
| Section | Extragalactic astronomy | |
| DOI | https://doi.org/10.1051/0004-6361/201424649 | |
| Published online | 19 January 2015 | |
New constraints on dust emission and UV attenuation of z = 6.5–7.5 galaxies from millimeter observations⋆
1 Observatoire de Genève, Université de Genève, 51 Ch. des Maillettes, 1290 Versoix, Switzerland
e-mail: This email address is being protected from spambots. You need JavaScript enabled to view it.
2 CNRS, IRAP, 14 avenue É. Belin, 31400 Toulouse, France
3 The Henry A. Rowland Department of Physics and Astronomy, Johns Hopkins University, 3400 N. Charles Street, MD 21218, Baltimore, USA
4 Observational Cosmology Lab., Code 665, NASA at Goddard Space Flight Center, MD 20771, Greenbelt, USA
5 The University of Texas at Austin, Austin, TX 78712, USA
6 Observatoire de Paris, LERMA, 61 Av. de l’Observatoire, 75014 Paris, France
Received: 21 July 2014
Accepted: 3 November 2014
Abstract
Context. Determining the dust properties and UV attenuation of distant star-forming galaxies is of great interest for our understanding of galaxy formation and cosmic star formation in the early Universe. However, few direct measurements exist so far.
Aims. To shed new light on these questions, we have targeted two recently discovered Lyman-break galaxies (LBGs) at z ≈ 6.8 and z = 7.508 to search for dust continuum and [C ii] λ158 μm line emission.
Methods. The strongly lensed z ≈ 6.8 LBG A1703-zD1 behind the galaxy cluster Abell 1703 and the spectroscopically confirmed z = 7.508 LBG z8-GND-5296 in the GOODS-N field were observed with the Plateau de Bure Interferometer (PdBI) at 1.2 mm. These observations were combined with those of three z> 6.5 Lyα emitters (HCM6A, Himiko, and IOK-1), for which deep measurements were recently obtained with the PdBI and ALMA.
Results. [C ii] is undetected in both galaxies, providing a deep upper limit of L[C II]< 2.8 × 10⁷L⊙ for A1703-zD1, comparable to the nondetections of Himiko and IOK-1 with ALMA. Dust continuum emission from A1703-zD1 and z8-GND-5296 is not detected with an rms of 0.12 and 0.16 mJy/beam. From these nondetections and earlier multiwavelength observations we derive upper limits on their IR luminosity and star formation rate, dust mass, and UV attenuation. Thanks to strong gravitational lensing, the achieved limit for A1703-zD1 is similar to those achieved with ALMA, probing below the luminous infrared galaxy (LIRG) regime (LIR< 8.1 × 10¹⁰L⊙) and very low dust masses (Md< 1.6 × 10⁷M⊙). We find that all five galaxies are compatible with the Calzetti IRX-β relation, their UV attenuation is compatible with several indirect estimates from other methods (the UV slope, extrapolation of the attenuation measured from the IR/UV ratio at lower redshift, and spectral energy distribution fits), and the dust-to-stellar mass ratio is compatible with that of galaxies from z = 0 to 3. From their stellar mass, the high-z galaxies studied here have an attenuation below the one expected from the mean relation of low-redshift (z ≲ 1.5) galaxies.
Conclusions. More and deeper (sub-)mm data are clearly needed to directly determine the UV attenuation and dust content of the dominant population of high-z star-forming galaxies and to establish their dependence on stellar mass, redshift, and other properties more firmly.
Key words: galaxies: high-redshift / galaxies: starburst / dust, extinction / galaxies: ISM / submillimeter: galaxies
Based on observations carried out with the IRAM Plateau de Bure Interferometer and the IRAM 30 m telescope. IRAM is supported by CNRS/INSU (France), the MPG (Germany) and the IGN (Spain).
© ESO, 2015
1. Introduction
The strong interest for galaxy formation and evolution in the early Universe and the high sensitivity of millimeter interferometers meet ideally at high redshifts. As a result of the well-known so-called negative k-correction, the observed flux from dust emission in galaxies increases with increasing distance at (sub)millimeter wavelengths, which in principle allows observations out to very high redshifts, z> 6 (cf. Blain et al. 2002). Since galaxy evolution in the early Universe remains poorly understood and since dust can strongly affect our view of star formation, it is essential to directly observe dust emission from the most distant galaxies.
The Lyman-break selection has been successful in tracing a large number of galaxies out to very high redshift, which has allowed constructing their luminosity function and thus determining the cosmic UV luminosity density and the associated star formation rate (SFR) density (Madau & Dickinson 2014, and references therein). Despite this, little is known about the UV attenuation of these galaxies and about the associated dust properties (mass, temperature, composition, etc.). Generally, the UV attenuation of Lyman-break galaxies (LBGs) at z> 3 is estimated from their UV slope β (e.g., Bouwens et al. 2014; Castellano et al. 2012) using empirical relations established at low redshift (e.g., the so-called Meurer relation, cf. Meurer et al. 1999), or from spectral energy distribution (SED) fits to the (rest frame) UV-optical part of the spectrum. Although the most direct measure of UV attenuation is determined by the ratio of IR/UV luminosity (Buat et al. 2005; Iglesias-Páramo et al. 2007), current measurements are limited by sensitivity to z ≲ 3 − 4 (Lee et al. 2012; Burgarella et al. 2013).
Thanks to strong gravitational lensing, the normal sensitivity limit has been overcome in a few cases in the past. Livermore et al. (2012), for example, have achieved a tentative detection of CO in a strongly lensed z = 4.9 star-forming galaxy with an SFR ≈ 40M⊙ yr-1 and stellar mass M⋆ ≈ 7. × 108M⊙, that is, properties similar to those of LBGs. The IR continuum of this galaxy has, however, remained undetected, with a limit corresponding to LIR< 3.5 × 10¹¹L⊙, as reported by Livermore et al. (2012). The z = 6.56 Lyα emitting galaxy (LAE) HCM6A, lensed by the galaxy cluster Abell 370, has been targeted by various studies aiming at detecting the dust continuum, CO, and [C ii] emission (Boone et al. 2007; Wagg et al. 2009; Kanekar et al. 2013). From the nondetection at 1.2 mm obtained with MAMBO-2 at the IRAM 30 m antenna, Boone et al. (2007) derived an upper limit of LIR/LUV ≲ 2 and an UV attenuation of AUV ≲ 0.9, which we here update using a more recent measurement from Kanekar et al. (2013). Until recently, this measurement has represented the best (lowest) constraint on UV attenuation in LBGs or LAE at high redshift (z> 5).
Two bright nonlensed LAEs, Himiko at z = 6.595 and IOK-1 at z = 6.96 (Ouchi et al. 2009; Iye et al. 2006), and the gamma-ray burst 090423 at z ~ 8.2 were also targeted by Walter et al. (2012) with the Plateau de Bure Interferometer (PdBI) in the 1.2 mm window, from which they concluded a low dust obscuration in these objects. Two other LAEs at z ~ 6.5, recently observed by González-López et al. (2014) with the PdBI in the 1.2 mm window, were also not detected (both in [C ii] and in the continuum). However, since their continuum sensitivity is a factor 2−5 lower than the one achieved for the lensed galaxy HCM6A and this galaxy is magnified by a factor μ ≈ 4.5, the effective limit on the LIR/LUV ratio, and hence the UV attenuation of these galaxies, is significantly less stringent than the limit obtained for HCM6A.
Himiko and IOK-1 have recently been observed with ALMA (Ouchi et al. 2013; Ota et al. 2014); these observations reached unprecedented depths in the 1.2 mm window (band 6), a factor 6–10 times more sensitive than the PdBI observations of HCM6A of Kanekar et al. (2013). Here, we combine these deep measurements with new PdBI observations of two interesting, bright high-z LBGs, the strongly lensed galaxy A1703-zD1 with a well-defined photometric redshift of z ≈ 6.8 discovered by Bradley et al. (2012), and z8-GND-5296, one of the most distant spectroscopically confirmed galaxies with z = 7.508 (Finkelstein et al. 2013). With an apparent H-band magnitude of 24, boosted by gravitational lensing by a factor ~9 (Bradley et al. 2012), A1703-zD1 is one of the brightest z ~ 7 galaxies, outshining Himiko and IOK-1 by ~1–1.6 mag in the near-IR (UV rest frame). The analysis of z8-GND-5296 yields indications for non-negligible UV attenuation and possibly an SFR in excess of 300 M⊙ yr-1 (Finkelstein et al. 2013), which clearly makes these two galaxies interesting targets for deep (sub-)mm observations.
Tuning the PdBI to the frequency of the [C ii] line, we have obtained observations reaching a continuum sensitivity of 0.12−0.16 mJy in the 1.2 mm window for these two high-z objects. The resulting continuum nondetections are used to provide limits on their IR luminosity, dust mass, and UV attenuation. Together with this data we consistently analyze the deepest available IR/mm data of Himiko, IOK-1, and HCM6A and in particular compare the derived UV attenuation with expectations for high-redshift LBGs; we also discuss the attenuation and dust mass as a function of stellar mass and how these quantities may evolve with redshift.
Our paper is structured as follows: the observational data are described in Sect. 2. In Sect. 3 we derive the IR luminosity and dust masses from the observations. Simple inferences on the UV attenuation and the stellar populations of the small sample are derived in Sect. 4. We then discuss our results for the IRX-β relation, UV attenuation as a function of redshift and stellar mass, dust mass, the [C ii] luminosity, and constraints on the SED fits of these objects in Sect. 5. Section 6 summarizes our main conclusions. We adopt a Λ-CDM cosmological model with H0 = 70 km s-1 Mpc-1, Ωm = 0.3 and ΩΛ = 0.7, use AB magnitudes, and assume a Salpeter IMF from 0.1 to 100 M⊙.
2. Observations
2.1. IRAM observations of the lensed galaxy A1703-zD1 and the GOODS-N source z8-GND-5296
We have obtained 1.2 mm observations of two sources, A1703-zD1 and z8-GND-5296, with the IRAM PdBI in the compact configuration and with the WIDEX backend covering a bandwidth of 3.6 GHz. A1703-zD1 was observed in May and August 2013 with five antennas, z8-GND-5296 was observed in December 2013 with six antennas. The central frequency of receiver 3 was tuned to the redshifted [C ii] line, whose rest frequency is 1900.54 GHz, that is, 241.5 GHz for A1703-zD1 and 223.88 GHz for z8-GND-5296. The quais-stellar objects (QSO) 1150+497, J1259+516 and 1347+539 were used as phase and amplitude calibrators for the observations of A1703-zD1 and 1150+497, and 1044+719 for the observations of z8-GND-5296. The bright sources 2200+420, MWC349, 3C84 and LKHA101 were also observed to calibrate the absolute flux and passband.
The Widex correlator covers the frequency range 240.2−243.8 GHz and 222.082−225.682 GHz, corresponding to the redshift ranges 6.796−6.912 for A1703-zD1 and 7.422−7.577 for z8-GND-5296. The redshift of A1703-zD1 was estimated from photometric observations. Bradley et al. (2012) found  , Smit et al. (2014)zphot = 6.8 ± 0.1, whereas we obtain a 68% confidence range of 6.7–6.9, with a median between 6.79 and 6.86, depending on which IRAC photometry was used (cf. below). Although zphot is fairly well defined, the exact probability of covering the [C ii] line is difficult to assess. For z8-GND, however, the redshift is based on the detection of the Lyα line, and the band covered corresponds to a velocity range [− 3078, 1752] km s-1 with respect to the systemic redshift determined from Lyα. Our tuning therefore probably fully covers the [C ii] emission from this galaxy.
The data were reduced using the GILDAS software. The data cubes were built using natural weighting to maximize the point source sensitivity. The beam sizes obtained are 2.30′′ × 1.75′′ for A1703-zD1 and 1.78′′ × 1.61′′ for z8-GND-5296. The continuum rms are 165 and 124 μJy and the line rms in 50 km s-1 channels are 1.52 and 1.83 mJy, respectively. None of the sources was detected. In passing, we note that none of the three other near-IR fainter z-drop galaxies (A1703-zD3, A1703-zD6, and A1703-zD7) from Bradley et al. (2012), which are also included in our field, were detected either.
Summary of millimeter observations and derived quantities.
In an earlier observing run with the IRAM 30 m telescope, we also obtained a deep 2 mm map of the Abell 1703 cluster with GISMO. No source was detected on the image, which reached a depth of 0.15 mJy rms/beam. We also examined the available Herschel PACS and SPIRE images of this cluster taken within the Herschel Lensing Survey (Egami et al. 2010). As expected, the galaxy A1703-zD1 is not detected down to ~1 mJy at 500 μm, and 40 mJy at the shortest wavelengths (70 μm). Because the most constraining data come from the 1.2 mm PdBI flux, the Herschel and GISMO limits were not used here to determine limits on the IR luminosity and dust mass.
2.2. Other data
From the literature we compiled the visible to near-IR (8 μm) data for A1703-zD1 and z8-GND-5296. The HST and IRAC photometry for A1703-zD1 was taken from Bradley et al. (2012). Smit et al. (2014) have remeasured the photometry of this object, finding differences in the IRAC filters (m3.6 = 23.66 and m4.5 = 24.93, Smit 2014, priv. comm.), which translates into a higher 3.6 μm excess than the data of Bradley et al. (2012). We therefore modeled both sets of photometry. The photometry of z8-GND-5296 was taken from Finkelstein et al. (2013).
We also analyzed three other related z> 6 objects for comparison: the strongly lensed z = 6.56 Lyα emitter HCM6A, the z = 6.96 Lyα emitter IOK-1, and the bright z = 6.595 Lyα blob called Himiko, which were previously observed at (sub-)millimeter wavelengths with IRAM and with ALMA (Boone et al. 2007; Walter et al. 2012; Kanekar et al. 2013; Ouchi et al. 2013; Ota et al. 2014). For HCM6A we used the recent IRAM data from Kanekar et al. (2013), which are somewhat deeper than our earlier MAMBO-2 observations. The ALMA observations of IOK-1 and Himiko are described in detail in Ota et al. (2014) and Ouchi et al. (2013). The corresponding millimeter observations (also nondetections) are summarized in Table 1.
All three objects have photometry in the near-IR (HST plus ground-based) and in the IRAC bands. Photometry for HCM6A has been compiled in Boone et al. (2007); Cowie et al. (2011) have obtained more recent measurements with WFC3/HST. The IRAC photometry of this galaxy is difficult/inconsistent because of contamination by neighboring sources. We therefore refrain from presenting detailed updated SED fits for this object (cf. Schaerer & Pelló 2005; Chary et al. 2005; Kanekar et al. 2013). For IOK-1 we used the WFC3/HST photometry of Cai et al. (2011) and the IRAC data from Egami (2014, priv. comm.). The total magnitudes for Himiko were taken from Ouchi et al. (2013).
Other z> 6 LBGs and LAEs have recently been observed in the mm-domain but are not included in our comparison, since the limits on their dust mass and UV attenuation are significantly less stringent than the limits for the objects listed in Table 1. This is the case for two other LAEs with confirmed spectroscopic redshifts at z ~ 6.5 that were recently observed at 1.2 mm with CARMA to search for [C ii] emission, and remained also undetected in the continuum (González-López et al. 2014). Their observations are a factor 2–5 fainter than those of Kanekar et al. (2013) for HCM6A, which furthermore is magnified by a factor ~4.5. Although their UV magnitudes are similar to the intrinsic, that is, lensing-corrected, one of HCM6A the constraint on LIR/LUV, hence UV attenuation, is therefore clearly weaker than for HCM6A. We also chose not to include the z ~ 9.6 lensed-galaxy candidate of Zheng et al. (2012) that was recently discussed by Dwek et al. (2014), since its association with the MACS1149-JD source is still inconclusive.
2.3. Observed SEDs
The “global” SEDs of A1703-zD1 and z8-GND-5296 from the near-IR to the millimeter domain are found to be similar to those of the other objects included here, which are HCM6A, IOK-1, and Himiko, and are therefore not shown here. Schematically, they are characterized by a relatively low IR/mm emission with respect to their rest-frame optical emission, similar to local dwarf galaxies and excluding SEDs of local ultra-luminous infrared galaxies (ULIRGs) or dusty star-forming galaxies such as Arp 220 or M 82, or even more normal spiral galaxies such as NGC 6949 (see Boone et al. 2007; Walter et al. 2012; Ouchi et al. 2013; González-López et al. 2014; Ota et al. 2014; Riechers et al. 2014).
3. IR and dust properties
The 1.2 mm observations listed in Table 1 were used to determine limits on the [C ii] 158 μm luminosity, L[C II], the total IR luminosity, LIR, and the dust mass, Md. The results are given in Tables 1 and 2 for three different values of the dust temperature Td.
The upper limits on the [C ii] line luminosities were computed by assuming a line width Δv = 50 km s-1 to be consistent with González-López et al. (2014) and by applying  (Solomon et al. 1992), where SC II is the line flux and DL the luminosity distance. Assuming a narrow line width results in a conservative estimate of the upper limit. After correcting for lensing, the upper limits on the [C ii] luminosity are very similar for all galaxies, log (L[C II]) < 7.45 − 7.6L⊙, except for z8-GND-5296, where the upper limit is approximately a factor 10 higher.
We computed the mass of dust by assuming a dust mass absorption coefficient κν = 1.875(ν/ν0)βIR m2 kg-1 with ν0 = 239.84 GHz and βIR = 1.5 and by removing the contribution of the CMB to the dust heating, as detailed by da Cunha et al. (2013a), and in a similar way to Ota et al. (2014). We also computed the IR luminosity of the dust heated by the stars (cosmic microwave background, CMB, contribution removed) by integrating the SED between 8 and 1000 μm assuming a modified blackbody SED with a power law in the Wien regime with a spectral index α = 2.9.
To examine how LIR and Md depend on the unknown dust temperature, we assumed three different values Td = 25, 35, and 45 K, where Td is the dust temperature before correcting for the CMB (i.e., Td is the temperature the dust would have without the CMB heating). Typically, the IR luminosity changes by a factor ≲ 3.2 − 3.7 for the range of dust temperatures (Td = 25 to 45 K), translating into an uncertainty of ≈ ± 0.25 dex. At z ~ 7 the CMB temperature is ~22 K. Ota et al. (2014) found Td = 27.6 K for the average dust temperature of local dwarf and irregular galaxies, whose SED may be similar to that of the high-z sources (cf. above). Slightly higher temperatures, Td ~ 30 − 35 K were found by Hirashita et al. (2014) for Himiko from dust modeling. From empirical arguments a higher dust temperature might be more appropriate for the high-z galaxies (cf. Magnelli et al. 2014; Sklias et al. 2014). Dust masses change by approximately a factor ~7 for Td = 25 to 45 K. For simplicity, we subsequently adopt LIR and Md values derived for the intermediate value of Td = 35 K.
Derived dust mass limits assuming different dust temperatures Td, a dust mass absorption coefficient κ125 = 1.875 m2 kg-1, and a dust emissivity index βIR = 1.5.
4. Stellar populations and the UV attenuation
4.1. Observed and derived properties
The absolute UV magnitude M1500 and UV luminosity, UV SFR (neglecting dust attenuation and assuming the Kennicutt (1998) calibration), UV slope β defined as Fλ ∝ λβ in a standard manner, the UV attenuation AUV, and the dust-obscured SFR(IR) of the objects are listed in Table 3.
The UV slopes are derived from the UV photometry using two bands or from our SED fits for these galaxies following well-known standard methods (e.g., Finkelstein et al. 2012; Bouwens et al. 2014; Ouchi et al. 2013). The typical uncertainty and differences between these methods is ± (0.3−0.5) on β, as also found from comparing our values with those listed in the literature. For A1703-zD1, for instance, Smit et al. (2014) found β = −1.4 ± 0.3, whereas our SED fits yield β ≈ −1.6. For z8-GND-5296, using two WFC3 photometric bands, one obtains β ≈ −1.4, compared with β ≈ −1.7 from our SED fits. Ouchi et al. (2013) found β = −2.00 ± 0.57 for Himiko.
Derived quantities.
The UV attenuation is constrained by the observed limit on LIR/LUV. We used the expression of Schaerer et al. (2013) relating the UV attenuation factor at 1800 Å, fUV, to x = log (LIR/LUV):  (1)By definition, AUV = 2.5log fUV. In Table 3 we list the upper limits on the UV attenuation using the 3σ limits on LIR(Td = 35), and Td = 25 and 45 K to estimate the uncertainty. For a specific attenuation law this can of course be translated into quantities such as AV. For the Calzetti law (Calzetti et al. 2000), for instance, AV = 2.5(RV/kλ)log fUV = 1.08log fUV = 0.43AUV, and E(B − V) = 0.26log fUV = 0.11AUV.
4.2. Stellar masses and SFRs
To obtain simple estimates of the SFR and stellar mass we use the “classical” SFR(UV) calibration of Kennicutt (1998) and the mean relation between the UV magnitude and stellar mass,  (2)obtained by Schaerer & de Barros (in prep.) from detailed SED fits including nebular emission to a sample of LBGs (z-drops at z ≈ 6.7). The corresponding values of SFR(UV) and M⋆(UV) are listed in Table 3. The uncertainty of a factor ~2 in stellar mass corresponds to the differences obtained for different SF histories (exponentially rising histories yield the lowest masses, exponentially declining ones intermediate masses, and constant SFR the highest mass), as described in Schaerer & de Barros (in prep.). In the last column of Table 3 we also list the upper limit of SFR(IR) derived from our limit on LIR(Td = 35), assuming again the standard calibration of Kennicutt (1998). Note that both SFR(UV) and SFR(IR) can underestimate the true SFR if the population dominating the UV emission is relatively young (< 100 Myr), as SED fits for some galaxies of our sample indicate (cf. Finkelstein et al. 2013). For this reason, and since the UV SFR is not corrected for dust attenuation in Table 3, SFR(UV) represents most likely a true lower limit on the current SFR of these galaxies.
Overall, these simple estimates yield stellar masses between ~ 109 and 1010M⊙ for the five galaxies studied here. Generally speaking, these values agree with earlier estimates, and the differences do not affect our conclusions. For A1703-zD1 Bradley et al. (2012) found masses in the range of M⋆ = (0.7 − 1.5) × 109M⊙, for a simple stellar population and constant SFR; the higher value perfectly agrees with our mass estimate. Their SFR = 7.3 ± 0.3M⊙ yr-1 is only slightly lower than our SFR(UV) value, probably due to the subsolar metallicity they adopted. For IOK-1 Ota et al. (2010) provided a rough mass estimate (in agreement with ours) that spans more than 1 dex depending on the age of the dominant population. In deeper Spitzer observations, which are now available, this galaxy is detected at 3.6 and 4.5 μm, yielding a stellar mass on the order of ~ 1. × 1010M⊙ (Egami et al., in prep.), which is compatible with our estimate. Our mass estimate for HCM6A is a factor ~2.4 higher than that of Kanekar et al. (2013). Schaerer & Pelló (2005) inferred a highest mass of ≲ 4 × 10⁹M⊙ after adjustment to the IMF assumed here. Himiko is the most massive galaxy according to our estimates. Ouchi et al. (2013) determined M⋆ ≈ 1.5 × 10¹⁰M⊙, which is a factor ~2.3 higher than our estimate. Their SFR = 100 ± 2M⊙ yr-1 from SED fits is most likely overestimated, as it includes an attenuation corresponding to AV = 0.6, which is clearly ruled out by their limit on the dust attenuation. Only for z8-GND-5296 our simple mass and SFR estimates differ from those derived previously. For this galaxy the SEDs fits favor very young ages (1−3 Myr), which leads to a lower mass (by a factor ~5) and higher SFR (on the order of 300−1000 M⊙ yr-1), according to Finkelstein et al. (2013). In any case, our main conclusions regarding the mass dependence of dust attenuation and the dust mass are not affected by these uncertainties on the stellar mass, as is made clear below (Sects. 5.3 and 5.4).
4.3. SED modeling
To examine the constraints provided by the limits on UV attenuation on derived physical parameters of our galaxies, we also carried out SED fits of these objects. The code and ingredients are the same as described in Schaerer & de Barros (2009, 2010) and Schaerer et al. (2013). Basically, we used a large set of spectral templates based on the GALAXEV synthesis models of Bruzual & Charlot (2003) that covers different metallicities and three different star formation histories (SFHs). Nebular emission was added. A Salpeter IMF from 0.1 to 100 M⊙ was adopted. The free parameters of our SED fits are age t⋆ defined since the onset of star-formation, attenuation AV described by the Calzetti law (Calzetti et al. 2000), and metallicity Z (of stars and gas). For all but one object, the redshift was fixed to the value from spectroscopy; for A1703-zD1 we treated z as a free parameter, although it is very well constrained by the sharp Lyman break (cf. Bradley et al. 2012).
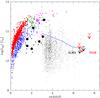 |
Fig. 1 IR luminosity (derived for Td = 35 K) versus redshift for the objects disussed here (arrows at z> 6.5) and for other samples. Colored small circles show individual galaxies detected with Herschel in various blank fields (red, Symeonidis et al. 2013; blue, Elbaz et al. 2011; green, Magdis et al. 2010). The observed behavior of LIR with redshift for these galaxies is due to sensitivity limits of Herschel, as shown, e.g., by Elbaz et al. (2011). Large and small black circles show the lensed galaxies studied by Sklias et al. (2014) and Saintonge et al. (2013). The small dots show the predicted IR luminosity of LBGs from the sample studied by de Barros et al. (2014) and Schaerer & de Barros (in prep.). The blue line shows the IR luminosity of galaxies with a typical UV magnitude |

5. Discussion
5.1. IR luminosity versus redshift – comparison with other galaxy samples and LBGs
To place our upper limits on the IR luminosity in a more general context and to compare them with IR detections of star-forming galaxies at lower redshift, we plot LIR versus redshift in Fig. 1. Clearly, the current limits for the z> 6.5 LBGs and LAE, all in the range of LIRG or sub-LIRG luminosities (i.e., < 1012L⊙ or even < 1011L⊙ for some objects), are well below the detection limits of z ≳ 2 galaxies with Herschel, but similar to the lowest LIR values of strongly lensed galaxies obtained currently at z ~ 2–3.
In Fig. 1 we also show the predicted IR luminosity of a sample of ~2000 LBGs between z ~ 3 and 7 analyzed by Schaerer & de Barros (in prep.). Although these values are obviously model dependent (as discussed in Schaerer & de Barros, in prep.), this illustrates the typical range of LIR expected for LBGs, that is, for galaxies selected with similar methods as the sources discussed here. Clearly, observations reaching similar depths as those presented here, or higher depths, should soon be able to detect “normal” LBGs over a wide redshift range. For more predictions on IR luminosities of LBGs see, for example, Schaerer et al. (2013), da Cunha et al. (2013b), Schaerer & de Barros (in prep.), or others. For predictions for high-redshift LAEs see, for eample, Finkelstein et al. (2009), Dayal et al. (2010).
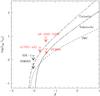 |
Fig. 2 IR/UV luminosity ratio versus UV slope β for our objects. The typical uncertainty on LIR/LUV due to the unknown dust temperature is about ± 0.25 dex; uncertainties in β are typically ± (0.3 − 0.5) (cf. Sect. 4.1). The long-dashed, solid, and dashed lines show the relations for different attenuation/extinction laws for comparison (cf. Calzetti et al. 2000; Takeuchi et al. 2012). |
5.2. IRX – beta relation
The ratio of the IR/UV luminosity (sometimes called IRX) is plotted as a function of the UV slope β in Fig. 2. Both quantities are commonly used to determine the UV attenuation. Within the relatively large uncertainties, the upper limits of LIR/LUV of all the z = 6.5 − 7.5 galaxies studied here are compatible with expectations for normal star-forming galaxies from the observed UV slope, as can be seen from comparison with the IRX-β relations of Meurer (labeled Calzetti here) and the revision by Takeuchi, which describes the locus of star-forming galaxies well. Clearly, our galaxies do not lie above the classical IRX-β relation in the region where often very dusty galaxies, such as ULIRGs, are found (e.g., Goldader et al. 2002). The present upper limits are, however, not yet constraining enough to assess whether high-z galaxies show lower LIR/LUV ratios than normal star-forming galaxies. Note also that the two lensed galaxies observed with IRAM (A1703-zD1 and HCM6A) provide the best constraints on the IRX-β relation, comparable to the ALMA data for Himiko and IOK-1.
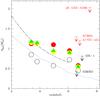 |
Fig. 3 UV attenuation AUV (upper limits, with uncertainties of ≈0.2−0.5, cf. Table 3 derived from LIR/LUV as a function of redshift. The colored symbols indicate the UV attenuation at the characteristic UV magnitude |

5.3. UV attenuation as a function of redshift and galaxy mass
The limits on the UV attenuation of the z = 6.5 − 7.5 galaxies are shown as a function of redshift in Fig. 3 and compared with other estimates for LBGs at these redshifts. Again, the upper limits derived from observations are compatible with expectations from simple relations between the UV slope and the UV attenuation (shown by the blue dotted line) and from our detailed SED models, which yield on average a higher UV attenuation for the reasons already discussed by de Barros et al. (2014) and Castellano et al. (2014). The UV attenuation from these SED models are also broadly in agreement with the extrapolation of the cosmic attenuation with redshift proposed by Burgarella et al. (2013) from IR and UV measurements at z ≲ 3. In short, the present data appear compatible with a median UV attenuation of fUV ~ 1.5 − 2 at z ≈ 7 found by Schaerer & de Barros (in prep.). In comparison, Bouwens et al. (2014) found E(B − V) = 0.02 − 0.03 from the UV slope at z ~ 7, which is a factor 1.5−2 lower than the above.
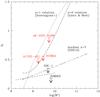 |
Fig. 4 Visual attenuation, AV ≈ AUV/ 2.5, for the objects of this study as a function of stellar mass. The typical uncertainty on stellar mass is about ± 0.3 dex (Conroy 2013; de Barros et al. 2014; Sklias et al. 2014). Uncertainties on AV are ≈ 0.1 − 0.2 (cf. Table 3). The dash-dotted and dotted lines show the mean relation for star-forming galaxies at z ~ 0 and z ~ 0.75 − 1.5 from Garn & Best (2010) and Domínguez et al. (2013). Two median relations for LBGs at z ~ 7 from Schaerer & de Barros (in prep.) are shown as long- and short-dashed lines. The former is derived from fitting directly M⋆ and AV, the latter shows the median M⋆ and AV values for LBGs with M1500 = −22 to − 18; both relations are for declining SFHs. |
From the nearby Universe out to z ~ 2 and possibly higher, various measurements (Balmer decrement, IR/UV, and others) yield a correlation between the dust attenuation and stellar mass that apparently also shows little or no evolution with redshift (Garn & Best 2010; Domínguez et al. 2013; Whitaker et al. 2012; Schaerer & de Barros 2010; Pannella et al. 2014). Even LBG samples at z ~ 3 − 7 show this correlation (cf. Schaerer & de Barros 2010, in prep.; de Barros et al. 2014), although these may be biased by selection effects. It is therefore interesting to examine the constraints placed by the new UV attenuation data as a function of the galaxy mass. This is shown in Fig. 4, where we also plot the mean relations derived at low redshift, the values derived from SED fits for z ~ 4 LBGs, and the median relation for z ~ 6.8 LBGs using the same SED fitting procedure.
The upper limits for two of our galaxies (IOK-1 and Himiko) lie quite clearly below the local relation, indicating less dust attenuation than would be expected on average for z ~ 0 galaxies with the same stellar mass. On the other hand, the limits on dust attenuation agree well or do not deviate strongly from the median relation found from our modeling of a sample of 70 LBGs with a median zphot = 6.7 (Schaerer & de Barros, in prep.). Although the upper limit for Himiko deviates most from this relation, we do not consider this as discrepant with expectations. Indeed, from SED modeling one also finds relatively massive galaxies with low attenuation (cf. Yabe et al. 2009; de Barros et al. 2014), as probably also corroborated by the empirical finding of an increasing scatter of the UV slope towards brighter magnitudes (cf. Rogers et al. 2014). In any case, the currently available samples are too small to draw significant conclusions on the existence or absence of the mass-attenuation relation at very high redshift, and thus on the possible redshift evolution of such a relation.
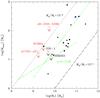 |
Fig. 5 Dust mass as a function of stellar mass for our objects (upper limits) and other related galaxies. The typical uncertainty on Md due to the unknown dust temperature is about ± 0.4 dex. Strongly lensed galaxies at z ~ 1.5 − 3 from Saintonge et al. (2013) and Sklias et al. (2014), who probed a similar mass range, are shown as black triangles and squares. The blue triangle shows the z = 6.34 starbursting galaxy HFLS3 from Cooray et al. (2014) with M⋆ adjusted to the Salpeter IMF. Typical uncertainties in stellar masses are a factor 2–3 (cf. Conroy 2013; Sklias et al. 2014), but can be higher in very dusty objects, such as HFLS3 described in Cooray et al. (2014). Dotted, dashed lines: Md/M⋆ = 10-2, 10-4 (M⋆ here assumes a Salpeter IMF). The green dashed line shows the location of the sequence observed by the H-ATLAS/GAMA survey at z ~ 0 − 0.35 (Bourne et al. 2012); the green solid line the median value of Md/M⋆ = −2.63 obtained by Smith et al. (2012) from the H-ATLAS survey after adjustment to the Salpeter IMF used here. The dust-to-stellar mass ratio of the high-z galaxies studied here is compatible with values observed at lower redshift, down to the nearby Universe. |
5.4. Dust mass in high-z galaxies
In Fig. 5 we plot the limits on the dust mass as a function of stellar mass and compare this with average values found in the nearby Universe and at higher redshift. We find that the present limits on dust mass are compatible with the standard dust-to-stellar mass ratios observed at low redshifts. They also agree with the recent observations of strongly lensed galaxies at z ~ 1 − 3 detected with Herschel (Saintonge et al. 2013; Sklias et al. 2014). At the high-mass end, the z = 6.34 starbursting galaxy HFLS3 detected by the HerMES survey also shows a standard dust-to-stellar mass ratio (cf. Riechers et al. 2013; Cooray et al. 2014). In short, we conclude that the available data for high-redshift star-forming galaxies may well be compatible with no significant evolution from z ~ 0 to 3 and out to the highest redshifts currently probed. The current data do not show evidence for a downturn of Md/M⋆ at high redshift, in contrast to the claim by Tan et al. (2014). As already mentioned, deeper observations and larger samples are needed to determine the evolution of dust with redshift, galaxy mass, and other parameters.
The ALMA observations of Himiko have been used by Hirashita et al. (2014) to place a limit on the dust production per supernova (SN) in the early Universe. This limit of 0.15−0.45 M⊙ is found to be compatible with those of many nearby SN remnants.
5.5. [C II] luminosity
The [C ii] line of our IRAM targets is not detected, meaning that none of the five z> 6.5 LBGs and LAEs studied here have been detected in [C ii]. Thus A1703-zD1, the three sources observed earlier, and maybe z8-GND-5296 are found to lie below the local L([C ii])–SFR relation, as already pointed out earlier by Kanekar et al. (2013), Ouchi et al. (2013), and Ota et al. (2014) for HCM6A, Himiko, and IOK-1, and as shown in the compilation of Ota et al. (2014), for instance. The deviation from the local relation is even stronger if other SFR indicators, such as from SED fits, are used, as these tend to yield higher SFRs for these galaxies, as already mentioned above. At somewhat lower redshift, z = 5.295, Riechers et al. (2014) have recently detected [C ii] emission from an LBG and found it to agree with the local L([C ii])–SFR relation. What distinguishes this object from our z> 6.5 sources remains to be understood.
Possible explanations for lower [C ii] emission in high-z galaxies have already been discussed in the literature, invoking compactness, lower metallicities, age effects, and others (cf. Stacey et al. 2010; Vallini et al. 2013; González-López et al. 2014; Ota et al. 2014), but are not fully understood. Empirically, [C ii] emission is also known to decrease in galaxies with increasing dust temperature (Graciá-Carpio et al. 2011; Diaz-Santos et al. 2013), and Td has been shown to increase toward higher redshift (e.g., Sklias et al. 2014). Again, the statistics is currently too poor to draw more general conclusions on the behavior of [C ii] emission at z> 6 and at even lower redshifts.
5.6. Constraints on SED models from LIR
It is interesting to compare the limits on UV attenuation derived from the IR/UV ratio (cf. above) with the UV attenuation obtained from SED fits for the same galaxies. By using AUV, it should in principle be possible to distinguish different SFHs, and direct attenuation measurements can resolve some of the degeneracies in SED fits, for example, between age and attenuation, which would also provide more accurate estimates of the SFR and stellar mass, and consequently also sSFR (cf. Reddy et al. 2012; Schaerer et al. 2013; Sklias et al. 2014).
5.6.1. Constraints on SF histories?
By comparing the results from our SED fits where extinction is kept as a free parameter with the AUV values from the IR/UV ratio, we found useful constraints for two objects, A1703-zD1 and Himiko. SED fits assuming exponentially rising or declining SFHs yield quite young ages (~10−40 Myr) and a high extinction AV ~ 0.5 − 0.95, that is, AUV ~ 1.1 − 2.2, (quoting here the range covered within 68% confidence for the Calzetti law) for these objects and also for z8-GND-5296. Ouchi et al. (2013) found values similar to ours for Himiko, translating into AUV = 1.38 with an uncertainty smaller than 0.1. With a 68% confidence, this high attenuation is excluded by the ALMA observations of Himiko. With rising SFHs we always find tight uncertainties on the attenuation for this object, the lowest value being AUV = 1.0 with a 99% confidence. For constant SFR or declining SFHs, however, we obtain lower values for the attenuation, compatible with the limit  from ALMA within 90–95% confidence. Taken at face value, this implies that exponentially rising star-formation histories are a poor description for the stellar populations of Himiko, as this would predict a too high UV attenuation. For A1703-zD1 the trend is similar, although the weaker limits on AUV imply that the SED models still agree to within ≳68−90% confidence.
We then ran SED fitting models where the UV attenuation was limited to the value derived above, that is, for the AUV from Table 3. We now discuss how this may affect the physical parameters, in particular, the specific SFR.
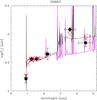 |
Fig. 6 Best-fit SEDs for Himiko with unconstrained models (magenta) or imposing the constraint on UV attenuation of AUV< 0.4 (black). Red crosses show the synthesized fluxes in the photometric bands, black circles the observations. The two solutions differ strongly in age, extinction, SFR, mass, and sSFR. The young one (magenta) overproduces the IR luminosity (see text). The IRAC channel 1 (3.6 μm) is contaminated by [O iii] λλ4959, 5007 and Hβ emission lines; Hα contributes weakly to channel 2 (4.5 μm). The relatively weak emission line at ~4.5 μm is He i λ5876. |
5.6.2. High specific SFR at z ~ 6.5–7.5?
We first examined Himiko, with the tightest limit on UV attenuation, by imposing AUV< 0.4 (i.e., AV< 0.17) on SED fits. The resulting best-fit SED for models with declining SFHs is shown in Fig. 6, where it is also compared with the unconstrained SED fit, which yields AV = 1. As can be clearly seen, the two fits differ strongly in a qualitative way, the former representing a relatively old population with a low attenuation, whereas the latter case is much younger, has stronger emission lines and a higher attenuation. Correspondingly, the older population yields a lower SFR and higher stellar mass, hence a lower sSFR than the unconstrained fits with M⋆ changing from ~ 1.0 × 10¹⁰ to 4.2 × 10¹⁰M⊙, SFR from ~160 to 20 M⊙ yr-1, and the specific SFR by a factor ≲40. For exponentially rising SFHs with the AUV constraint, we obtain AV = 0.15, M⋆ ~ 2.0 × 10¹⁰ M⊙, SFR ~ 30M⊙ yr-1, that is, an sSFR ~ 1.5 Gyr-1. It is therefore possible that Himiko has a relatively low sSFR (even close to the often quoted conservative value of 1−2 Gyr-1 cf. González et al. 2014). Part of the difficulty of distinguishing these solutions stems from the fact that both IRAC filters can be contaminated by emission lines at the redshift of Himiko (z = 6.595), and from the finding of the 4.5 μm flux observed stronger than at 2.2 μm. Measurements of the rest-frame optical emission lines of [O iii] λλ4959, 5007, Hβ (in the 3.6 μm filter) and/or Hα at 4.5 μm, or an accurate determination of the continuum flux at these wavelengths are necessary to precisely determine the current SFR of this galaxy and its stellar mass.
For A1703-zD1 the situation seems clearer because the observed 4.5 μm flux is weak, fainter than at near-IR (1−2 μm), and a significant excess at 3.6 μm is found compared with 4.5 μm (see Fig. 7)1. In this case, an old population (significant Balmer break) is clearly excluded, meaning that the stellar mass must be relatively low, and the (strong) 3.6 μm excess implies a high current SFR. Hence the specific SFR of this galaxy is much better constrained than for Himiko and must be fairly high, as also found by Smit et al. (2014). For A1703-zD1, models both with or without imposed constraints on the UV attenuation, with declining or rising SFHs, and for two different measurements of the IRAC photometry, indeed yield a high sSFR ~ 20–90 Gyr-1.
In short, solutions with very young ages, hence high SFR, lower mass, and the highest sSFR are disfavored for some of our galaxies such as Himiko. The young population Finkelstein et al. (2013) we find for z8-GND-5296 is not excluded by the current IRAM data, leaving, however, large uncertainties on the physical parameters of this object. To conclude about the sSFR of HCM6A and IOK-1, accurate IRAC flux measurements are needed (cf. Sect. 2.2). Because both IRAC filters are affected by nebular emission lines at the redshift of these galaxies, degeneracies will remain between the derived physical parameters. Direct emission line measurements (e.g., with the JWST) are crucial to firmly establish the properties of such high-redshift galaxies.
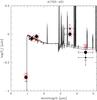 |
Fig. 7 Best-fit SEDs for A1703-zD1 with constrained models (AUV< 1.2) to two different sets of IRAC measurements (cf. Sect. 2.2). Red crosses show the synthesized fluxes in the photometric bands, black circles the observations. In both cases the resulting fit parameters are quite similar, which confirms the high specific SFR for this galaxy. The same is also obtained without the constraint on UV attenuation. |
6. Conclusion
We have carried out deep 1.2 mm observations with the Plateau de Bure Interferometer, targeting [C II] λ158 μm and dust continuum emission of two z ~ 7 LBGs, A1703-zD1 and z8-GND-5296, which were discovered earlier by Bradley et al. (2012) and Finkelstein et al. (2013). A1703-zD1 is a bright LBG, magnified by a factor μ = 9 by the lensing cluster Abell 1703. z8-GND-5296 is currently one of the most distant spectroscopically confirmed galaxies at z = 7.508.
We combined our observations with those of other z> 6.5 star-forming galaxies with spectroscopic redshifts (three LAEs named HCM6A, Himiko, and IOK-1), for which deep measurements were recently obtained with the PdBI and ALMA (Kanekar et al. 2013; Ouchi et al. 2013; Ota et al. 2014). For this small sample of five high-z star-forming galaxies we determined the IR and hence the dust properties of the stellar emission in a homogeneous manner, from which we derived limits on the IR luminosities and SFRs, dust masses, the [C ii] luminosity, UV attenuation, and stellar masses.
Our main results are the following:
-
The dust continuum of A1703-zD1 and z8-GND-5296 is not detected down to an rms of0.12 and 0.16 mJy/beam at 241and 223 GHz. From this we obtained upper limits onthe IR luminosity of LIR(Td = 35) < 8.1 × 10¹⁰L⊙ and< 6.7 × 10¹¹L⊙ for A1703-zD1 and z8-GND-5296, assuming a dust tem-perature Td = 35 K before correcting for CMB heating.Thanks to strong gravitational lensing, our observations ofA1703-zD1 reach a similar effective depth as therecent ALMA observations of Himiko and IOK-1, which alsoprobe the sub-LIRG (LIR< 1011L⊙) regime.
-
The upper limits of LIR/LUV of the five galaxies and their observed UV slope β follow quite closely the so-called IRX-β relation expected for the Calzetti attenuation law.
-
The UV attenuation, derived from the ratio of LIR/LUV, is found to be between
for Himiko (the lowest limit), and AUV< 1.2 − 1.3 for the lensed galaxies A1703-zD1 and HCM6A. Broadly, these limits are compatible with extrapolations of AUV measurements from the IR and UV at lower redshift (Burgarella et al. 2013) and with classical estimates from the UV slope (e.g., Bouwens et al. 2014). The available limits are also compatible with results from recent SED fits for large samples of LBGs, which indicates that the UV attenuation may be higher than derived using the standard relation between the UV slope and attenuation (de Barros et al. 2014; Castellano et al. 2014). -
For their stellar mass (on the order of M⋆ ~ (2 − 10) × 109M⊙) the high-z galaxies studied here have an attenuation lower than expected from the mean relation observed for local galaxies and out to z ~ 1.5 (cf. Domínguez et al. 2013). The current limits are, however, compatible with the median relation between M⋆ and attenuation derived by Schaerer & de Barros (in prep.) for z ~ 7 LBGs.
-
The limits on the dust masses for A1703-zD1 are Md(Td = 35) < 1.6 × 10⁷M⊙ and < 13.9 × 10⁷M⊙ for z8-GND-5296. The available data/limits for z> 6 galaxies show dust-to-stellar mass ratios that are compatible with that of galaxies from z = 0 to 3. Deeper observations are required to establish whether the dust-to-stellar mass ratio decreases at high redshift, for instance, as a result of lower metallicity.
-
If the redshift of A1703-zD1 is confirmed within our targeted range (z ∈ [6.796,6.912]), our nondetection for this galaxy adds another limit on the [C ii] λ158 μm luminosity (L[C II]< 2.8 × 10⁷L⊙), showing that the z> 6 galaxies observed so far emit less [C ii] than expected from their SFR when compared with low redshift galaxies (cf. Ouchi et al. 2013; Ota et al. 2014). [C ii] emission from z8-GND-5296 is not detected with an upper limit of L[C II]< 3.6 × 10⁸L⊙.
-
The derived limits on the UV attenuation exclude some SED fits, which indicates very young ages and may place better limits on the specific SFR at high redshift. However, the emission lines in several IRAC filters currently prevent accurate determinations of the SFR and stellar mass of z> 6 galaxies, except over a narrow redshift interval (z ~ 6.8 − 7.0; cf. Smit et al. 2014). For A1703-zD1 we confirm the very high sSFR ~ 20–90 Gyr-1 of A1703-zD1 derived by Smit et al. (2014).
Although our new measurements provide some additional insight, more and deeper (sub-)mm data, of both lensed and blank field galaxies, are clearly needed to determine the UV attenuation and dust content of the dominant population of the most distant star-forming galaxies and their evolution with redshift, and to understand the apparent lack of [C ii] emission from these galaxies and their ISM properties more in general.
The interpretation of the SED of A1703-zD1 is also clearer since its redshift is most likely z ~ 6.8 ± 0.1, in a range where Hα has moved out of the 4.5 μm filter, which provides a high contrast between the 3.6 and 4.5 μm bands, as also highlighted by Smit et al. (2014).
Acknowledgments
We thank IRAM, in particular Tessel van der Laan, for efficient observations and help with data reduction. This work was supported by the Swiss National Science Foundation. J.S. and the GISMO observations were supported through NSF ATI grants 1020981 and 1106284. We made use of the public Cosmolopy python package from Roban Kramer (http://roban.github.com/CosmoloPy/), the python version of Ned Wright’s cosmology calculator, from James Schombert, TOPCAT (Taylor 2005), and the NASA ADS services. This paper makes use of the following ALMA data: ADS/JAO.ALMA#2011.0.00115.S and ADS/JAO.ALMA#2011.0.00767.S. ALMA is a partnership of ESO (representing its member states), NSF (USA) and NINS (Japan), together with NRC (Canada) and NSC and ASIAA (Taiwan), in cooperation with the Republic of Chile. The Joint ALMA Observatory is operated by ESO, AUI/NRAO and NAOJ.
References
- Blain, A. W., Smail, I., Ivison, R. J., Kneib, J.-P., & Frayer, D. T. 2002, Phys. Rep., 369, 111 [NASA ADS] [CrossRef] [Google Scholar]
- Boone, F., Schaerer, D., Pelló, R., Combes, F., & Egami, E. 2007, A&A, 475, 513 [NASA ADS] [CrossRef] [EDP Sciences] [Google Scholar]
- Bourne, N., Maddox, S. J., Dunne, L., et al. 2012, MNRAS, 421, 3027 [NASA ADS] [CrossRef] [Google Scholar]
- Bouwens, R. J., Illingworth, G. D., Oesch, P. A., et al. 2014, ApJ, 793, 115 [Google Scholar]
- Bradley, L. D., Bouwens, R. J., Zitrin, A., et al. 2012, ApJ, 747, 3 [NASA ADS] [CrossRef] [Google Scholar]
- Bruzual, G., & Charlot, S. 2003, MNRAS, 344, 1000 [NASA ADS] [CrossRef] [Google Scholar]
- Buat, V., Iglesias-Páramo, J., Seibert, M., et al. 2005, ApJ, 619, L51 [NASA ADS] [CrossRef] [Google Scholar]
- Burgarella, D., Buat, V., Gruppioni, C., et al. 2013, A&A, 554, A70 [NASA ADS] [CrossRef] [EDP Sciences] [Google Scholar]
- Cai, Z., Fan, X., Jiang, L., et al. 2011, ApJ, 736, L28 [NASA ADS] [CrossRef] [Google Scholar]
- Calzetti, D., Armus, L., Bohlin, R. C., et al. 2000, ApJ, 533, 682 [NASA ADS] [CrossRef] [Google Scholar]
- Castellano, M., Fontana, A., Grazian, A., et al. 2012, A&A, 540, A39 [NASA ADS] [CrossRef] [EDP Sciences] [Google Scholar]
- Castellano, M., Sommariva, V., Fontana, A., et al. 2014, A&A, 566, A19 [NASA ADS] [CrossRef] [EDP Sciences] [Google Scholar]
- Chary, R.-R., Stern, D., & Eisenhardt, P. 2005, ApJ, 635, L5 [NASA ADS] [CrossRef] [Google Scholar]
- Conroy, C. 2013, ARA&A, 51, 393 [NASA ADS] [CrossRef] [Google Scholar]
- Cooray, A., Calanog, J., Wardlow, J. L., et al. 2014, ApJ, 790, 40 [NASA ADS] [CrossRef] [Google Scholar]
- Cowie, L. L., Hu, E. M., & Songaila, A. 2011, ApJ, 735, L38 [NASA ADS] [CrossRef] [Google Scholar]
- da Cunha, E., Groves, B., Walter, F., et al. 2013a, ApJ, 766, 13 [Google Scholar]
- da Cunha, E., Walter, F., Decarli, R., et al. 2013b, ApJ, 765, 9 [NASA ADS] [CrossRef] [Google Scholar]
- Dayal, P., Hirashita, H., & Ferrara, A. 2010, MNRAS, 403, 620 [NASA ADS] [CrossRef] [Google Scholar]
- de Barros, S., Schaerer, D., & Stark, D. P. 2014, A&A, 563, A81 [NASA ADS] [CrossRef] [EDP Sciences] [Google Scholar]
- Diaz-Santos, T., Armus, L., Charmandaris, V., et al. 2013, ApJ, 774, 68 [NASA ADS] [CrossRef] [Google Scholar]
- Domínguez, A., Siana, B., Henry, A. L., et al. 2013, ApJ, 763, 145 [NASA ADS] [CrossRef] [Google Scholar]
- Dwek, E., Staguhn, J., Arendt, R. G., et al. 2014, ApJ, 788, L30 [NASA ADS] [CrossRef] [Google Scholar]
- Egami, E., Rex, M., Rawle, T. D., et al. 2010, A&A, 518, L12 [CrossRef] [EDP Sciences] [Google Scholar]
- Elbaz, D., Dickinson, M., Hwang, H. S., et al. 2011, A&A, 533, A119 [NASA ADS] [CrossRef] [EDP Sciences] [Google Scholar]
- Finkelstein, S. L., Malhotra, S., Rhoads, J. E., Hathi, N. P., & Pirzkal, N. 2009, MNRAS, 393, 1174 [NASA ADS] [CrossRef] [Google Scholar]
- Finkelstein, S. L., Papovich, C., Salmon, B., et al. 2012, ApJ, 756, 164 [NASA ADS] [CrossRef] [Google Scholar]
- Finkelstein, S. L., Papovich, C., Dickinson, M., et al. 2013, Nature, 502, 524 [NASA ADS] [CrossRef] [Google Scholar]
- Garn, T., & Best, P. N. 2010, MNRAS, 409, 421 [NASA ADS] [CrossRef] [Google Scholar]
- Goldader, J. D., Meurer, G., Heckman, T. M., et al. 2002, ApJ, 568, 651 [NASA ADS] [CrossRef] [Google Scholar]
- González, V., Bouwens, R., Illingworth, G., et al. 2014, ApJ, 781, 34 [NASA ADS] [CrossRef] [Google Scholar]
- González-López, J., Riechers, D. A., Decarli, R., et al. 2014, ApJ, 784, 99 [NASA ADS] [CrossRef] [Google Scholar]
- Graciá-Carpio, J., Sturm, E., Hailey-Dunsheath, S., et al. 2011, ApJ, 728, L7 [NASA ADS] [CrossRef] [Google Scholar]
- Hirashita, H., Ferrara, A., Dayal, P., & Ouchi, M. 2014, MNRAS, 443, 1704 [NASA ADS] [CrossRef] [Google Scholar]
- Iglesias-Páramo, J., Buat, V., Hernández-Fernández, J., et al. 2007, ApJ, 670, 279 [NASA ADS] [CrossRef] [Google Scholar]
- Iye, M., Ota, K., Kashikawa, N., et al. 2006, Nature, 443, 186 [NASA ADS] [CrossRef] [PubMed] [Google Scholar]
- Kanekar, N., Wagg, J., Ram Chary, R., & Carilli, C. L. 2013, ApJ, 771, L20 [NASA ADS] [CrossRef] [Google Scholar]
- Kennicutt, Jr., R. C. 1998, ARA&A, 36, 189 [Google Scholar]
- Lee, K.-S., Alberts, S., Atlee, D., et al. 2012, ApJ, 758, L31 [NASA ADS] [CrossRef] [Google Scholar]
- Livermore, R. C., Swinbank, A. M., Smail, I., et al. 2012, ApJ, 758, L35 [NASA ADS] [CrossRef] [Google Scholar]
- Madau, P., & Dickinson, M. 2014, ARA&A, 52, 415 [NASA ADS] [CrossRef] [Google Scholar]
- Magdis, G. E., Elbaz, D., Hwang, H. S., et al. 2010, MNRAS, 409, 22 [NASA ADS] [CrossRef] [Google Scholar]
- Magnelli, B., Lutz, D., Saintonge, A., et al. 2014, A&A, 561, A86 [NASA ADS] [CrossRef] [EDP Sciences] [Google Scholar]
- Meurer, G. R., Heckman, T. M., & Calzetti, D. 1999, ApJ, 521, 64 [NASA ADS] [CrossRef] [Google Scholar]
- Ota, K., Ly, C., Malkan, M. A., et al. 2010, PASJ, 62, 1167 [NASA ADS] [Google Scholar]
- Ota, K., Walter, F., Ohta, K., et al. 2014, ApJ, 792, 34 [NASA ADS] [CrossRef] [Google Scholar]
- Ouchi, M., Ono, Y., Egami, E., et al. 2009, ApJ, 696, 1164 [NASA ADS] [CrossRef] [Google Scholar]
- Ouchi, M., Ellis, R., Ono, Y., et al. 2013, ApJ, 778, 102 [NASA ADS] [CrossRef] [Google Scholar]
- Pannella, M., Elbaz, D., Daddi, E., et al. 2014, ApJ, submitted [arXiv:1407.5072] [Google Scholar]
- Reddy, N. A., Pettini, M., Steidel, C. C., et al. 2012, ApJ, 754, 25 [NASA ADS] [CrossRef] [Google Scholar]
- Riechers, D. A., Bradford, C. M., Clements, D. L., et al. 2013, Nature, 496, 329 [Google Scholar]
- Riechers, D. A., Carilli, C. L., Capak, P. L., et al. 2014, ApJ, 796, 84 [NASA ADS] [CrossRef] [Google Scholar]
- Rogers, A. B., McLure, R. J., Dunlop, J. S., et al. 2014, MNRAS, 440, 3714 [NASA ADS] [CrossRef] [Google Scholar]
- Saintonge, A., Lutz, D., Genzel, R., et al. 2013, ApJ, 778, 2 [NASA ADS] [CrossRef] [Google Scholar]
- Schaerer, D., & de Barros, S. 2009, A&A, 502, 423 [NASA ADS] [CrossRef] [EDP Sciences] [Google Scholar]
- Schaerer, D., & de Barros, S. 2010, A&A, 515, A73 [NASA ADS] [CrossRef] [EDP Sciences] [Google Scholar]
- Schaerer, D., & Pelló, R. 2005, MNRAS, 362, 1054 [NASA ADS] [CrossRef] [Google Scholar]
- Schaerer, D., de Barros, S., & Sklias, P. 2013, A&A, 549, A4 [NASA ADS] [CrossRef] [EDP Sciences] [Google Scholar]
- Sklias, P., Zamojski, M., Schaerer, D., et al. 2014, A&A, 561, A149 [NASA ADS] [CrossRef] [EDP Sciences] [Google Scholar]
- Smit, R., Bouwens, R. J., Labbé, I., et al. 2014, ApJ, 784, 58 [NASA ADS] [CrossRef] [Google Scholar]
- Smith, D. J. B., Dunne, L., da Cunha, E., et al. 2012, MNRAS, 427, 703 [NASA ADS] [CrossRef] [Google Scholar]
- Stacey, G. J., Hailey-Dunsheath, S., Ferkinhoff, C., et al. 2010, ApJ, 724, 957 [NASA ADS] [CrossRef] [Google Scholar]
- Symeonidis, M., Vaccari, M., Berta, S., et al. 2013, MNRAS, 431, 2317 [NASA ADS] [CrossRef] [Google Scholar]
- Takeuchi, T. T., Yuan, F.-T., Ikeyama, A., Murata, K. L., & Inoue, A. K. 2012, ApJ, 755, 144 [NASA ADS] [CrossRef] [Google Scholar]
- Tan, Q., Daddi, E., Magdis, G., et al. 2014, A&A, 569, A98 [NASA ADS] [CrossRef] [EDP Sciences] [Google Scholar]
- Taylor, M. B. 2005, in Astronomical Data Analysis Software and Systems XIV, eds. P. Shopbell, M. Britton, & R. Ebert, ASP Conf. Ser., 347, 29 [Google Scholar]
- Vallini, L., Gallerani, S., Ferrara, A., & Baek, S. 2013, MNRAS, 433, 1567 [NASA ADS] [CrossRef] [Google Scholar]
- Wagg, J., Kanekar, N., & Carilli, C. L. 2009, ApJ, 697, L33 [NASA ADS] [CrossRef] [Google Scholar]
- Walter, F., Decarli, R., Carilli, C., et al. 2012, ApJ, 752, 93 [NASA ADS] [CrossRef] [Google Scholar]
- Whitaker, K. E., van Dokkum, P. G., Brammer, G., & Franx, M. 2012, ApJ, 754, L29 [NASA ADS] [CrossRef] [Google Scholar]
- Yabe, K., Ohta, K., Iwata, I., et al. 2009, ApJ, 693, 507 [NASA ADS] [CrossRef] [Google Scholar]
- Zheng, W., Postman, M., Zitrin, A., et al. 2012, Nature, 489, 406 [NASA ADS] [CrossRef] [PubMed] [Google Scholar]
All Tables
Derived dust mass limits assuming different dust temperatures Td, a dust mass absorption coefficient κ125 = 1.875 m2 kg-1, and a dust emissivity index βIR = 1.5.
All Figures
|
Fig. 1 IR luminosity (derived for Td = 35 K) versus redshift for the objects disussed here (arrows at z> 6.5) and for other samples. Colored small circles show individual galaxies detected with Herschel in various blank fields (red, Symeonidis et al. 2013; blue, Elbaz et al. 2011; green, Magdis et al. 2010). The observed behavior of LIR with redshift for these galaxies is due to sensitivity limits of Herschel, as shown, e.g., by Elbaz et al. (2011). Large and small black circles show the lensed galaxies studied by Sklias et al. (2014) and Saintonge et al. (2013). The small dots show the predicted IR luminosity of LBGs from the sample studied by de Barros et al. (2014) and Schaerer & de Barros (in prep.). The blue line shows the IR luminosity of galaxies with a typical UV magnitude |
| In the text | |
|
Fig. 2 IR/UV luminosity ratio versus UV slope β for our objects. The typical uncertainty on LIR/LUV due to the unknown dust temperature is about ± 0.25 dex; uncertainties in β are typically ± (0.3 − 0.5) (cf. Sect. 4.1). The long-dashed, solid, and dashed lines show the relations for different attenuation/extinction laws for comparison (cf. Calzetti et al. 2000; Takeuchi et al. 2012). |
| In the text | |
|
Fig. 3 UV attenuation AUV (upper limits, with uncertainties of ≈0.2−0.5, cf. Table 3 derived from LIR/LUV as a function of redshift. The colored symbols indicate the UV attenuation at the characteristic UV magnitude |
| In the text | |
|
Fig. 4 Visual attenuation, AV ≈ AUV/ 2.5, for the objects of this study as a function of stellar mass. The typical uncertainty on stellar mass is about ± 0.3 dex (Conroy 2013; de Barros et al. 2014; Sklias et al. 2014). Uncertainties on AV are ≈ 0.1 − 0.2 (cf. Table 3). The dash-dotted and dotted lines show the mean relation for star-forming galaxies at z ~ 0 and z ~ 0.75 − 1.5 from Garn & Best (2010) and Domínguez et al. (2013). Two median relations for LBGs at z ~ 7 from Schaerer & de Barros (in prep.) are shown as long- and short-dashed lines. The former is derived from fitting directly M⋆ and AV, the latter shows the median M⋆ and AV values for LBGs with M1500 = −22 to − 18; both relations are for declining SFHs. |
| In the text | |
|
Fig. 5 Dust mass as a function of stellar mass for our objects (upper limits) and other related galaxies. The typical uncertainty on Md due to the unknown dust temperature is about ± 0.4 dex. Strongly lensed galaxies at z ~ 1.5 − 3 from Saintonge et al. (2013) and Sklias et al. (2014), who probed a similar mass range, are shown as black triangles and squares. The blue triangle shows the z = 6.34 starbursting galaxy HFLS3 from Cooray et al. (2014) with M⋆ adjusted to the Salpeter IMF. Typical uncertainties in stellar masses are a factor 2–3 (cf. Conroy 2013; Sklias et al. 2014), but can be higher in very dusty objects, such as HFLS3 described in Cooray et al. (2014). Dotted, dashed lines: Md/M⋆ = 10-2, 10-4 (M⋆ here assumes a Salpeter IMF). The green dashed line shows the location of the sequence observed by the H-ATLAS/GAMA survey at z ~ 0 − 0.35 (Bourne et al. 2012); the green solid line the median value of Md/M⋆ = −2.63 obtained by Smith et al. (2012) from the H-ATLAS survey after adjustment to the Salpeter IMF used here. The dust-to-stellar mass ratio of the high-z galaxies studied here is compatible with values observed at lower redshift, down to the nearby Universe. |
| In the text | |
|
Fig. 6 Best-fit SEDs for Himiko with unconstrained models (magenta) or imposing the constraint on UV attenuation of AUV< 0.4 (black). Red crosses show the synthesized fluxes in the photometric bands, black circles the observations. The two solutions differ strongly in age, extinction, SFR, mass, and sSFR. The young one (magenta) overproduces the IR luminosity (see text). The IRAC channel 1 (3.6 μm) is contaminated by [O iii] λλ4959, 5007 and Hβ emission lines; Hα contributes weakly to channel 2 (4.5 μm). The relatively weak emission line at ~4.5 μm is He i λ5876. |
| In the text | |
|
Fig. 7 Best-fit SEDs for A1703-zD1 with constrained models (AUV< 1.2) to two different sets of IRAC measurements (cf. Sect. 2.2). Red crosses show the synthesized fluxes in the photometric bands, black circles the observations. In both cases the resulting fit parameters are quite similar, which confirms the high specific SFR for this galaxy. The same is also obtained without the constraint on UV attenuation. |
| In the text | |
Current usage metrics show cumulative count of Article Views (full-text article views including HTML views, PDF and ePub downloads, according to the available data) and Abstracts Views on Vision4Press platform.
Data correspond to usage on the plateform after 2015. The current usage metrics is available 48-96 hours after online publication and is updated daily on week days.
Initial download of the metrics may take a while.