Fig. 3
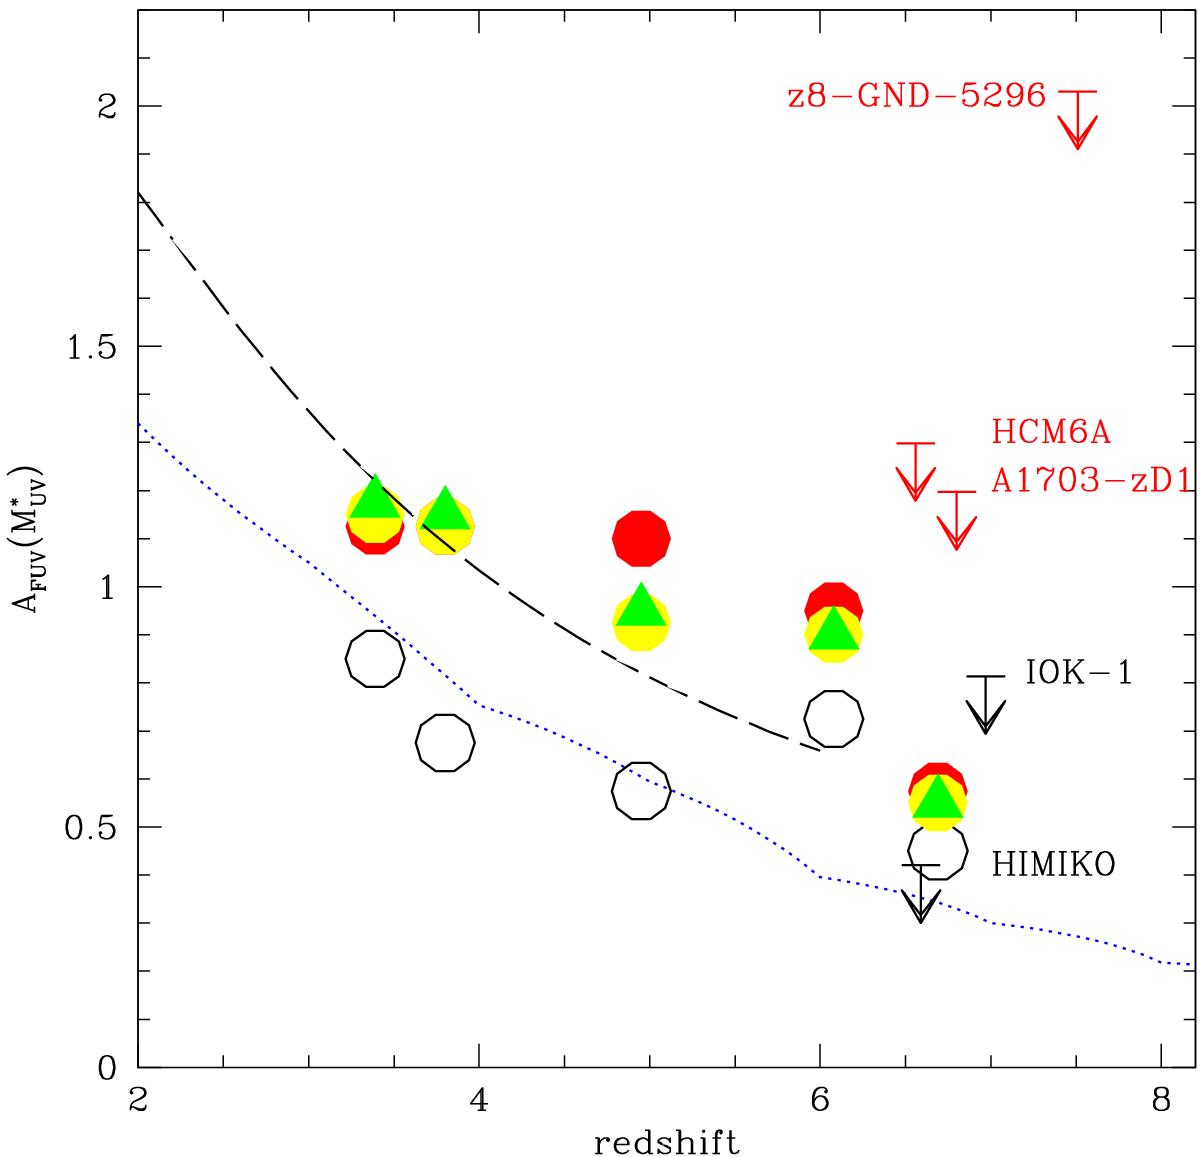
UV attenuation AUV (upper limits, with uncertainties of ≈0.2−0.5, cf. Table 3 derived from LIR/LUV as a function of redshift. The colored symbols indicate the UV attenuation at the characteristic UV magnitude ![]() derived from the sample of z ~ 3 − 7 LBGs by Schaerer & de Barros (in prep.) for different SFHs and including nebular emission (yellow: exponentially declining, red: exponentially rising, green: delayed SFHs). The black circles stand for models with constant SFR neglecting nebular emission. The long-dashed line shows the extrapolation of the average UV attenuation measured from IR and UV luminosity functions at z ≲ 3 by Burgarella et al. (2013). The blue dotted line corresponds to AUV derived from the UV slope following Bouwens et al. (2014).
derived from the sample of z ~ 3 − 7 LBGs by Schaerer & de Barros (in prep.) for different SFHs and including nebular emission (yellow: exponentially declining, red: exponentially rising, green: delayed SFHs). The black circles stand for models with constant SFR neglecting nebular emission. The long-dashed line shows the extrapolation of the average UV attenuation measured from IR and UV luminosity functions at z ≲ 3 by Burgarella et al. (2013). The blue dotted line corresponds to AUV derived from the UV slope following Bouwens et al. (2014).
Current usage metrics show cumulative count of Article Views (full-text article views including HTML views, PDF and ePub downloads, according to the available data) and Abstracts Views on Vision4Press platform.
Data correspond to usage on the plateform after 2015. The current usage metrics is available 48-96 hours after online publication and is updated daily on week days.
Initial download of the metrics may take a while.