Fig. 5
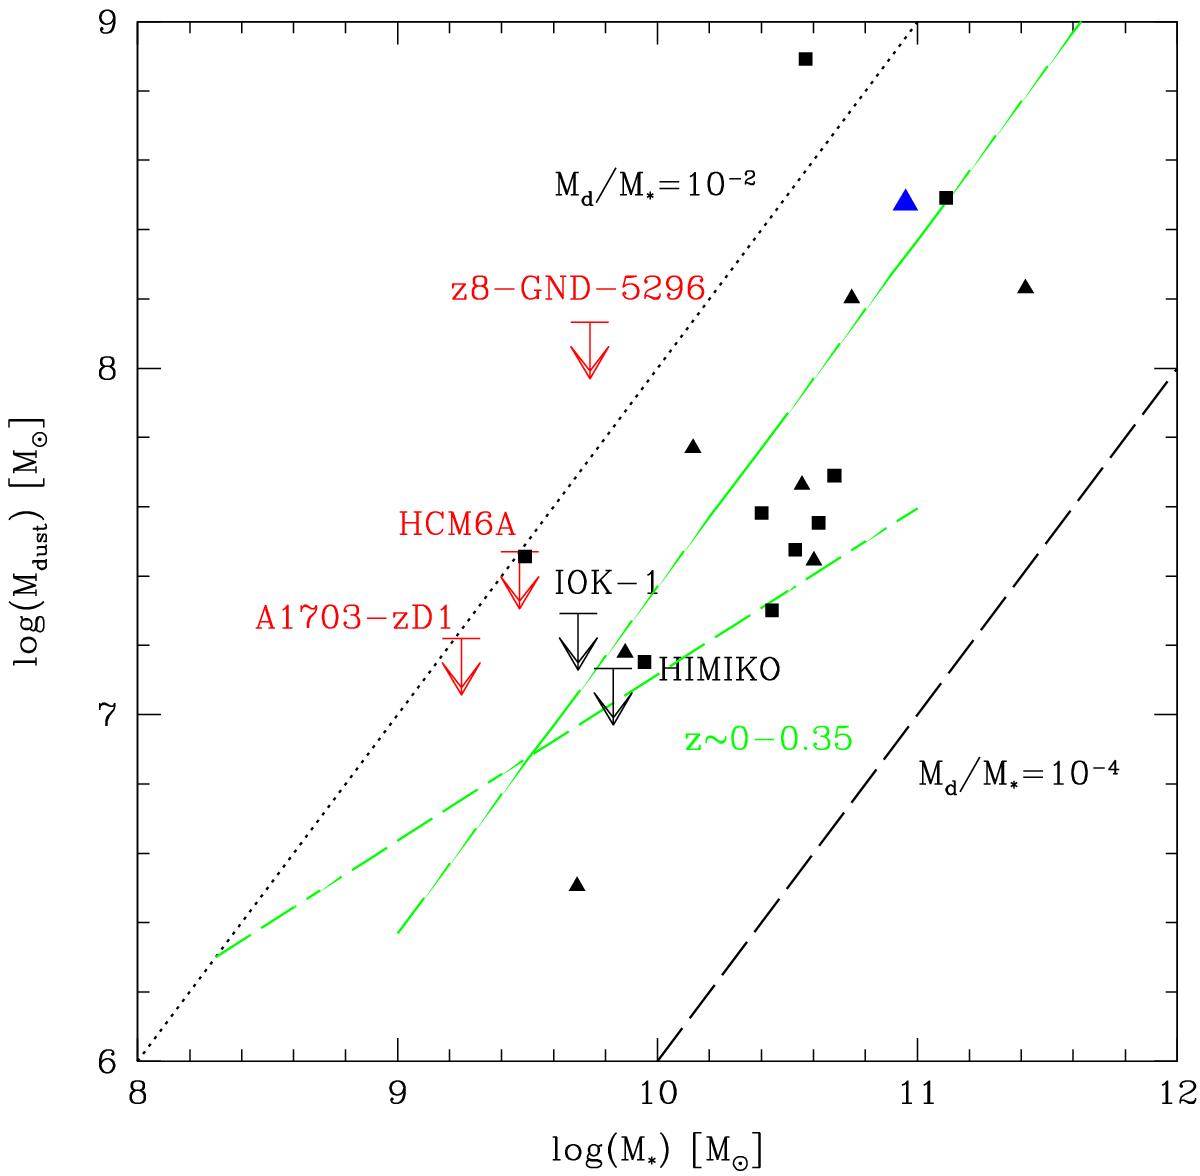
Dust mass as a function of stellar mass for our objects (upper limits) and other related galaxies. The typical uncertainty on Md due to the unknown dust temperature is about ± 0.4 dex. Strongly lensed galaxies at z ~ 1.5 − 3 from Saintonge et al. (2013) and Sklias et al. (2014), who probed a similar mass range, are shown as black triangles and squares. The blue triangle shows the z = 6.34 starbursting galaxy HFLS3 from Cooray et al. (2014) with M⋆ adjusted to the Salpeter IMF. Typical uncertainties in stellar masses are a factor 2–3 (cf. Conroy 2013; Sklias et al. 2014), but can be higher in very dusty objects, such as HFLS3 described in Cooray et al. (2014). Dotted, dashed lines: Md/M⋆ = 10-2, 10-4 (M⋆ here assumes a Salpeter IMF). The green dashed line shows the location of the sequence observed by the H-ATLAS/GAMA survey at z ~ 0 − 0.35 (Bourne et al. 2012); the green solid line the median value of Md/M⋆ = −2.63 obtained by Smith et al. (2012) from the H-ATLAS survey after adjustment to the Salpeter IMF used here. The dust-to-stellar mass ratio of the high-z galaxies studied here is compatible with values observed at lower redshift, down to the nearby Universe.
Current usage metrics show cumulative count of Article Views (full-text article views including HTML views, PDF and ePub downloads, according to the available data) and Abstracts Views on Vision4Press platform.
Data correspond to usage on the plateform after 2015. The current usage metrics is available 48-96 hours after online publication and is updated daily on week days.
Initial download of the metrics may take a while.