Fig. 7
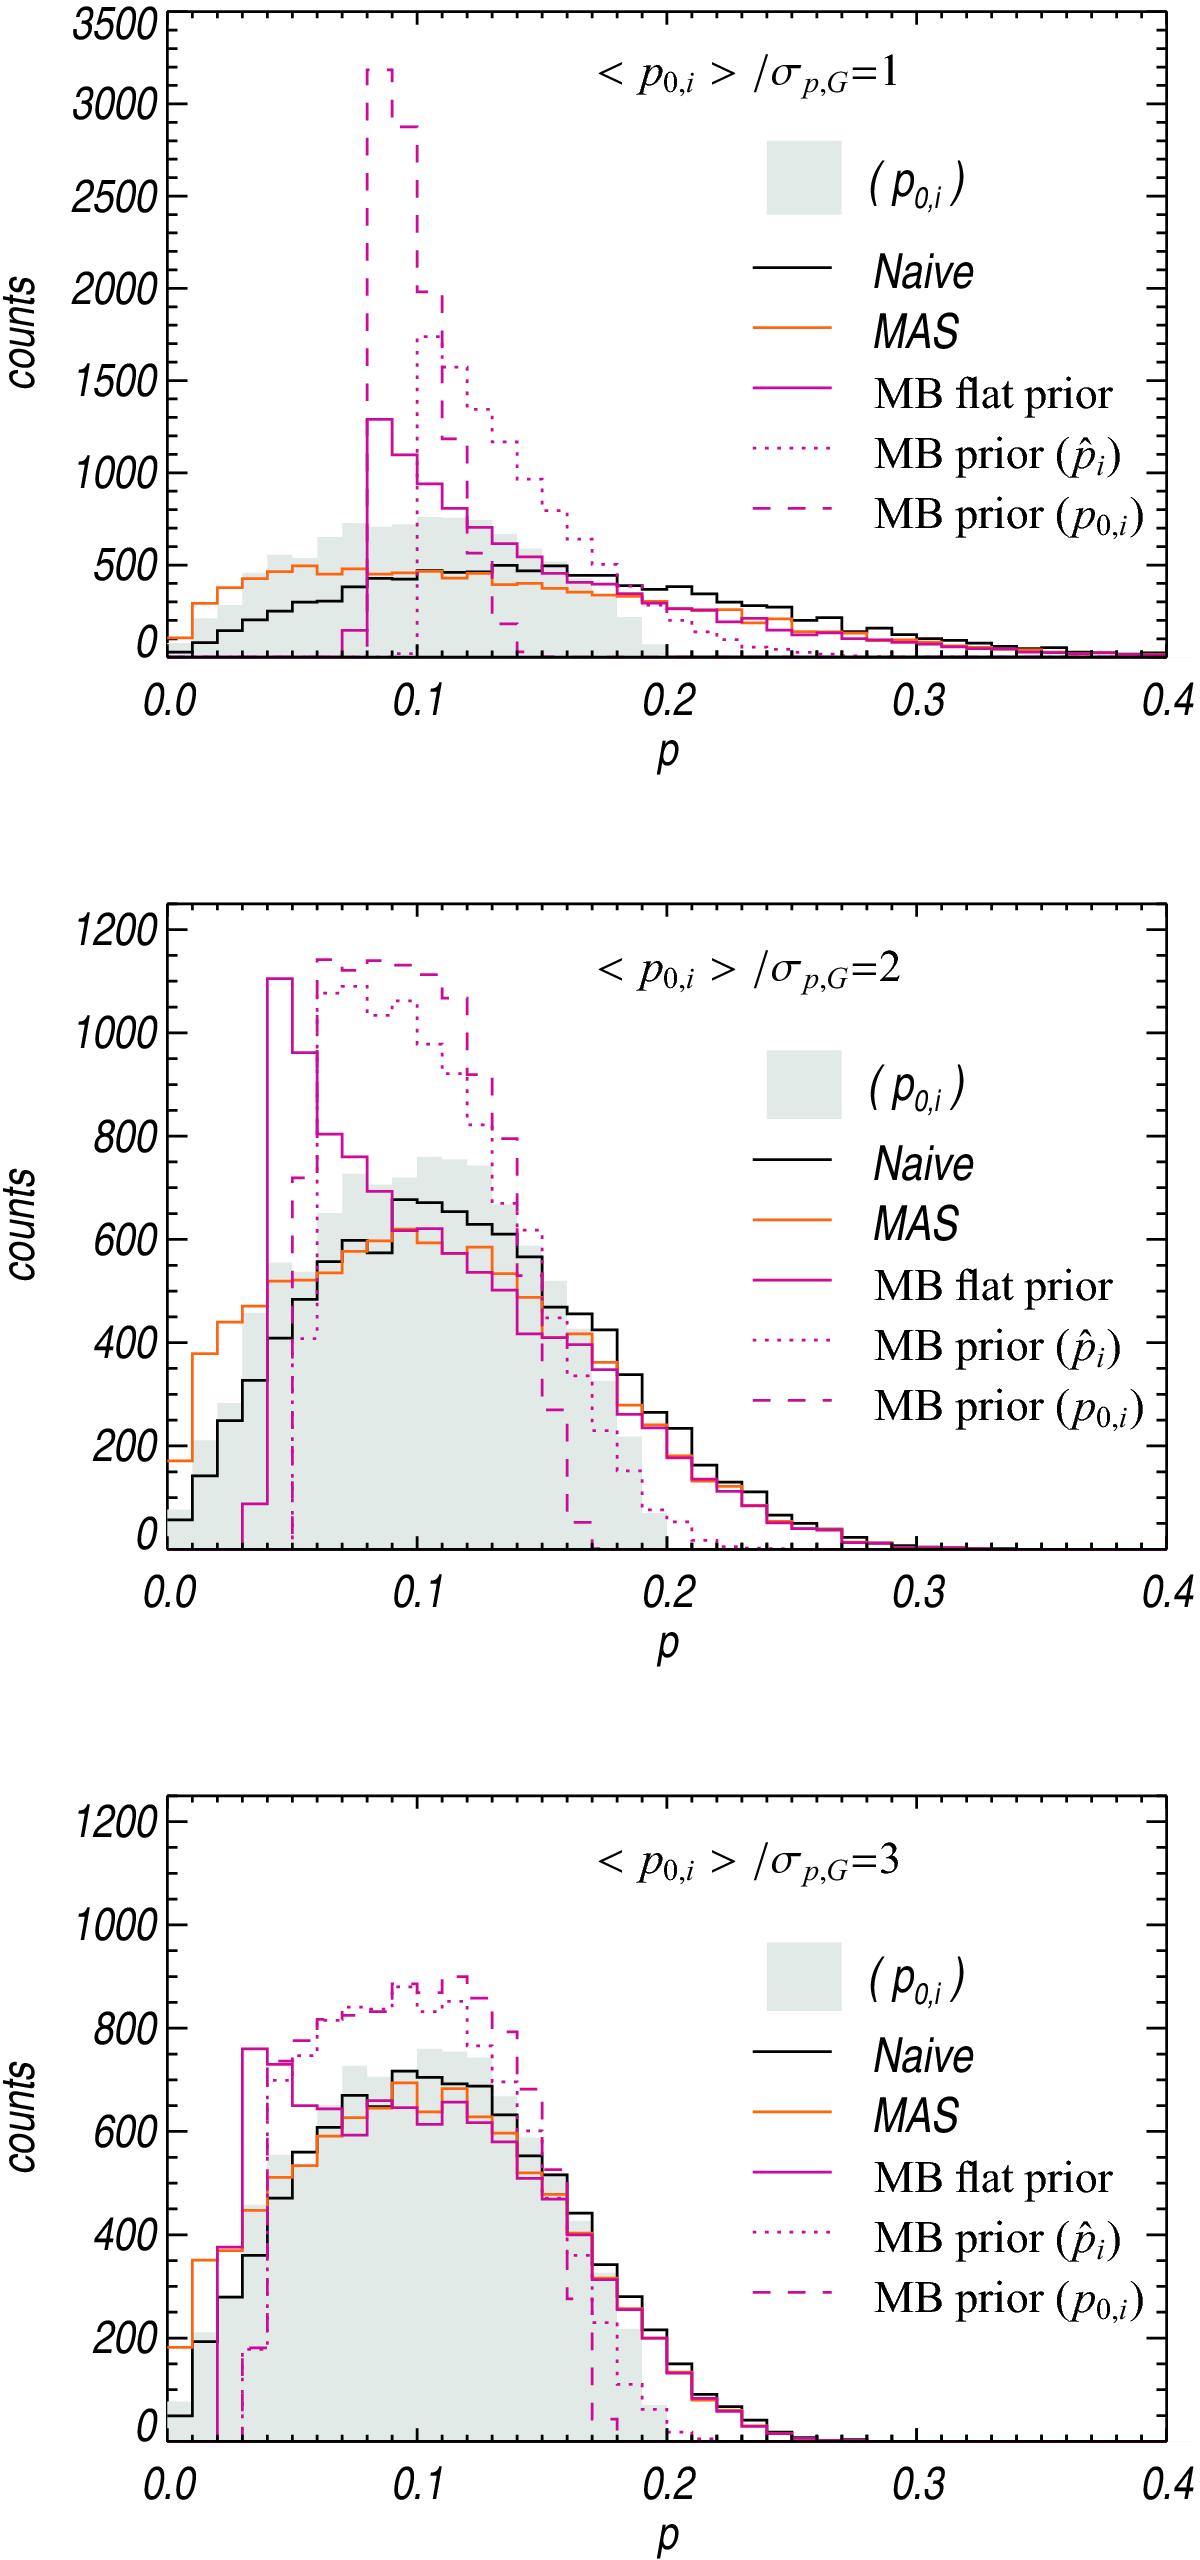
Output distributions of the ![]() estimates starting from a distribution of 10 000 simulated independent true values (p0,i) centred on 10% of polarization fraction (grey shaded region) shown at three levels of noise characterized by the mean S/N ⟨ p0,i ⟩ /σp,G = 1,2, and 3 (top, middle, and bottom, respectively). The naïve (black) and MAS (orange) output distributions are compared to the MB output distributions obtained with three different priors: flat prior between 0 and 1 (solid pink), to the naïve output distribution (dotted pink), and to the true input distribution (dashed pink).
estimates starting from a distribution of 10 000 simulated independent true values (p0,i) centred on 10% of polarization fraction (grey shaded region) shown at three levels of noise characterized by the mean S/N ⟨ p0,i ⟩ /σp,G = 1,2, and 3 (top, middle, and bottom, respectively). The naïve (black) and MAS (orange) output distributions are compared to the MB output distributions obtained with three different priors: flat prior between 0 and 1 (solid pink), to the naïve output distribution (dotted pink), and to the true input distribution (dashed pink).
Current usage metrics show cumulative count of Article Views (full-text article views including HTML views, PDF and ePub downloads, according to the available data) and Abstracts Views on Vision4Press platform.
Data correspond to usage on the plateform after 2015. The current usage metrics is available 48-96 hours after online publication and is updated daily on week days.
Initial download of the metrics may take a while.