Fig. 4
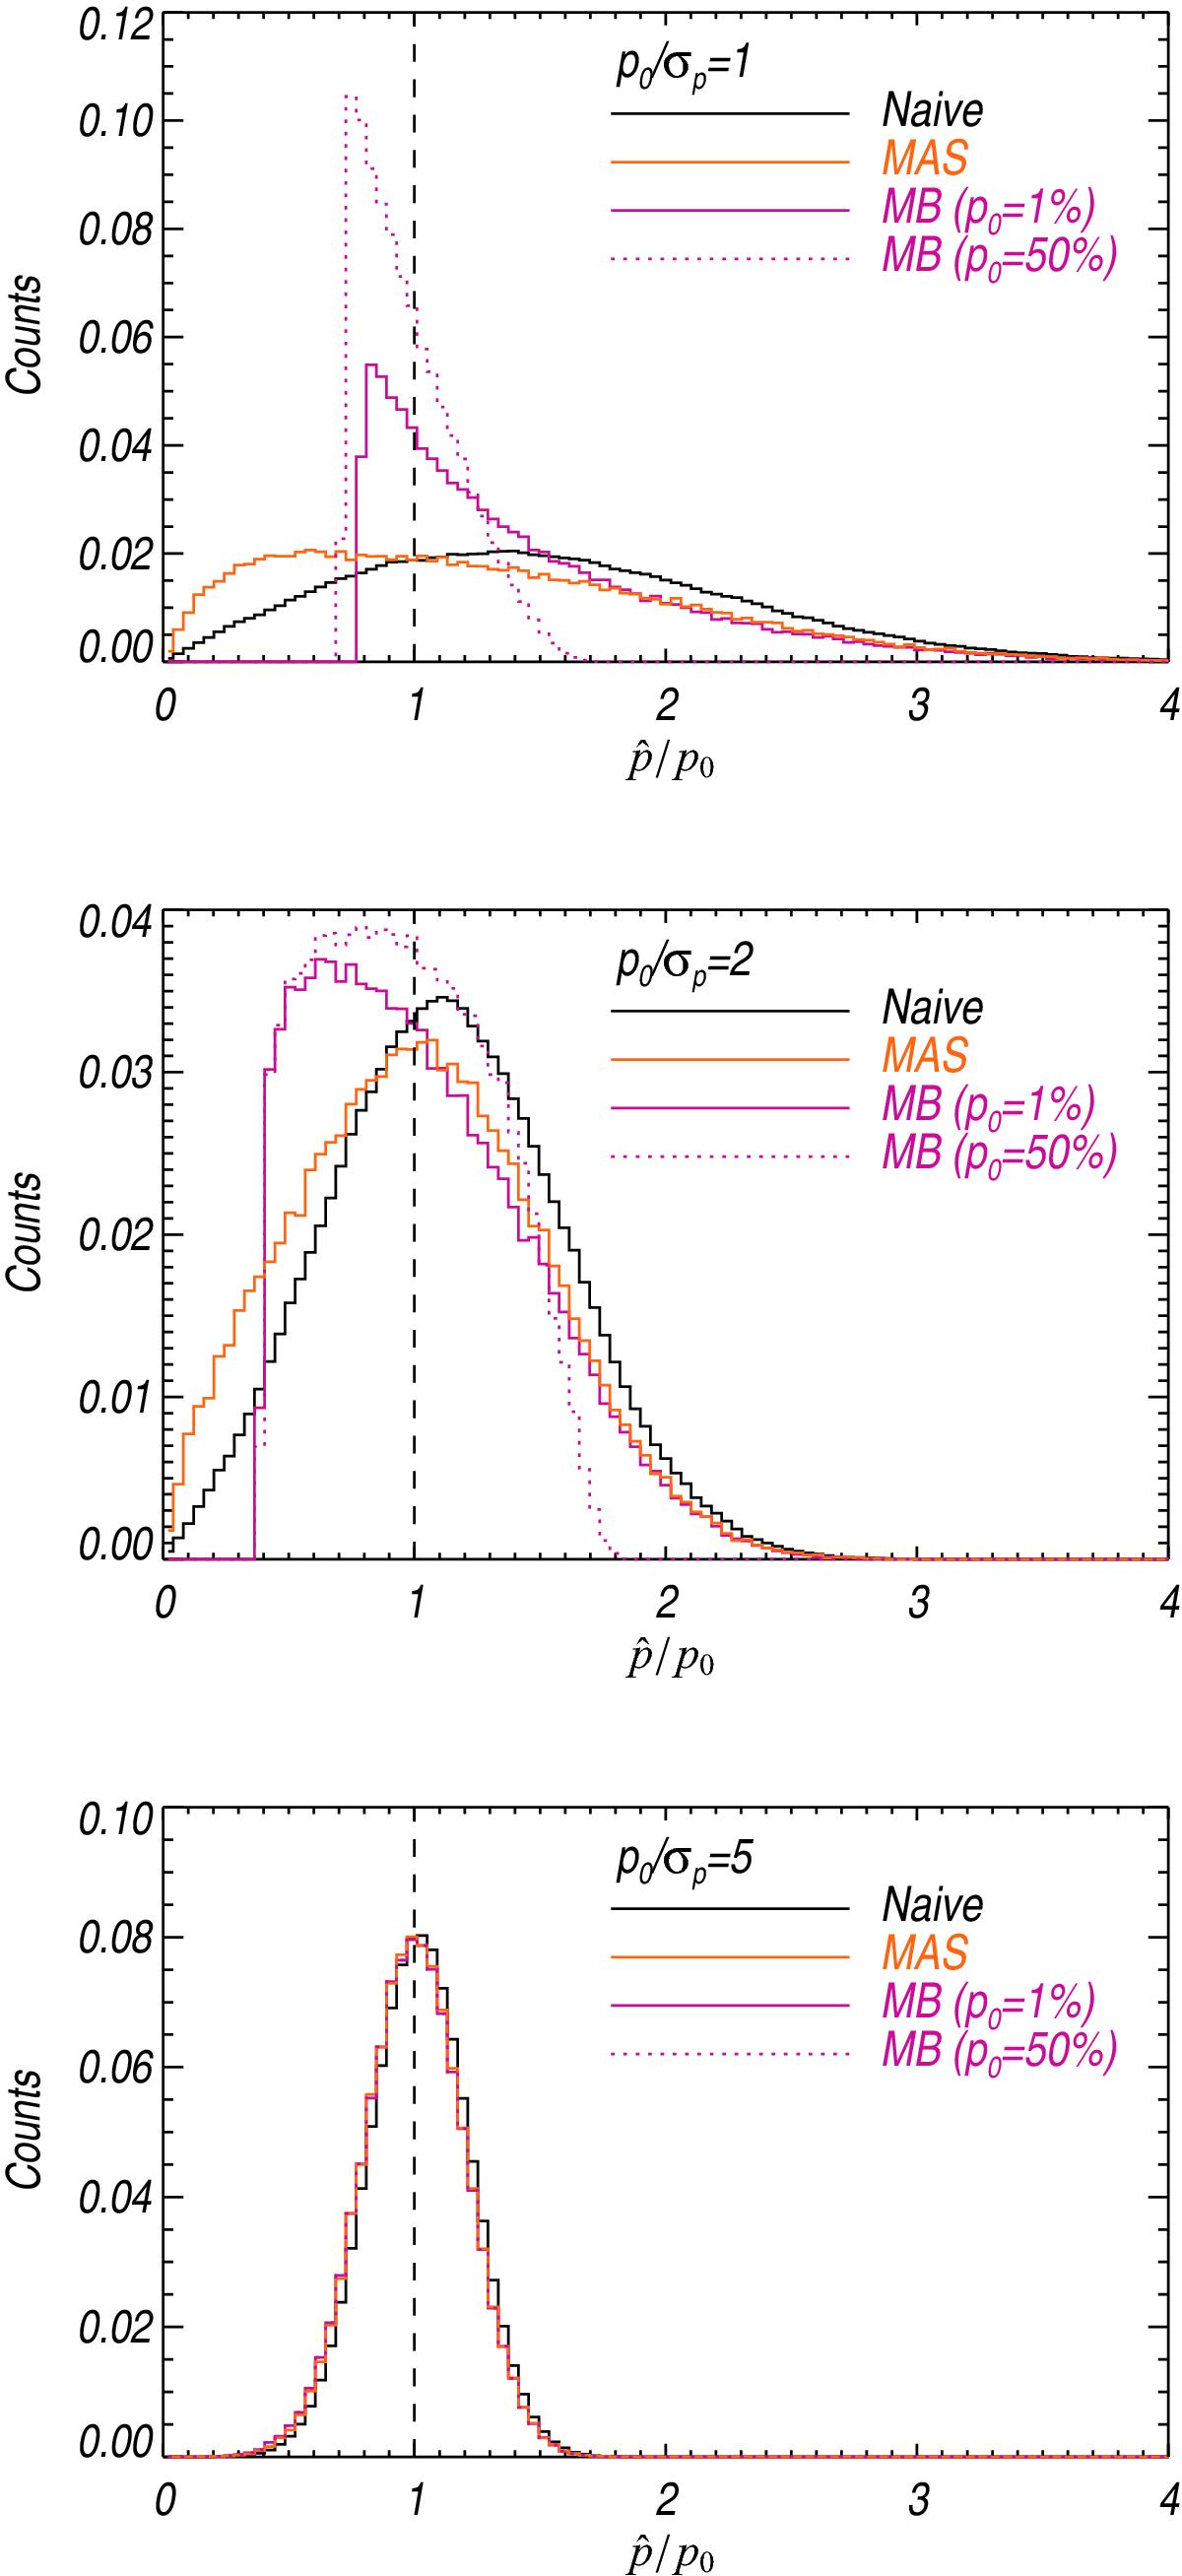
Output distributions of the naïve (black), MAS (orange), and the MB (pink) ![]() estimators applied to 100 000 Monte-Carlo simulations using a covariance matrix in the canonical case (εeff = 1), for three levels of the S/N p0/σp = 1,2, and 5 (from top to bottom). In the case of the MB estimator, we show two setups of p0 = 1% and 50% to illustrate the dependence of the output distribution on the p0 value, due to the prior used in the Bayesian approach (
estimators applied to 100 000 Monte-Carlo simulations using a covariance matrix in the canonical case (εeff = 1), for three levels of the S/N p0/σp = 1,2, and 5 (from top to bottom). In the case of the MB estimator, we show two setups of p0 = 1% and 50% to illustrate the dependence of the output distribution on the p0 value, due to the prior used in the Bayesian approach (![]() so that
so that ![]() ). The other estimators are not sensitive to the true value p0. The MB and MAS curves overlap in the bottom panel.
). The other estimators are not sensitive to the true value p0. The MB and MAS curves overlap in the bottom panel.
Current usage metrics show cumulative count of Article Views (full-text article views including HTML views, PDF and ePub downloads, according to the available data) and Abstracts Views on Vision4Press platform.
Data correspond to usage on the plateform after 2015. The current usage metrics is available 48-96 hours after online publication and is updated daily on week days.
Initial download of the metrics may take a while.