Free Access
Fig. 13
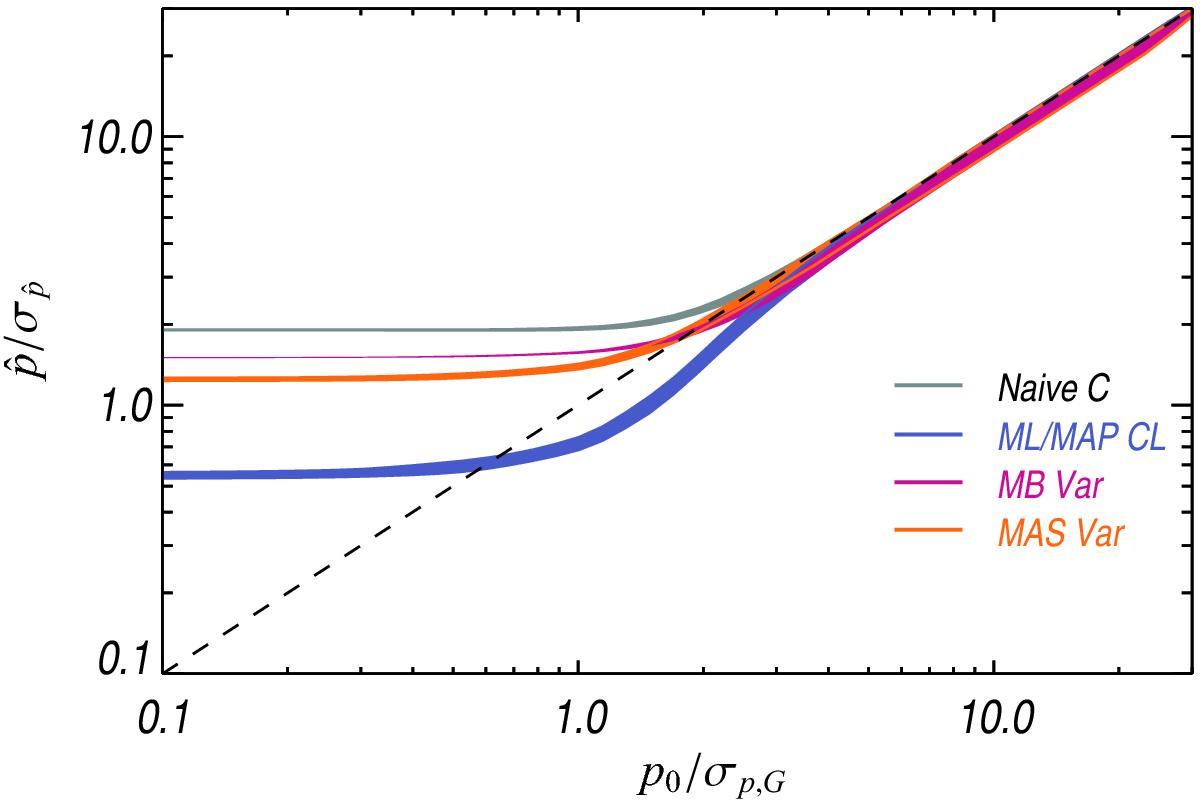
Average measured S/N computed over 10 000 Monte-Carlo simualtions as a function of the true S/N for four methods: naïve ![]() (dark), MAP confidence intervals
(dark), MAP confidence intervals ![]() (blue), MB
(blue), MB ![]() (pink), and MAS variance
(pink), and MAS variance ![]() (orange). The covariance matrix is taken in its low regime.
(orange). The covariance matrix is taken in its low regime.
Current usage metrics show cumulative count of Article Views (full-text article views including HTML views, PDF and ePub downloads, according to the available data) and Abstracts Views on Vision4Press platform.
Data correspond to usage on the plateform after 2015. The current usage metrics is available 48-96 hours after online publication and is updated daily on week days.
Initial download of the metrics may take a while.