Fig. 6
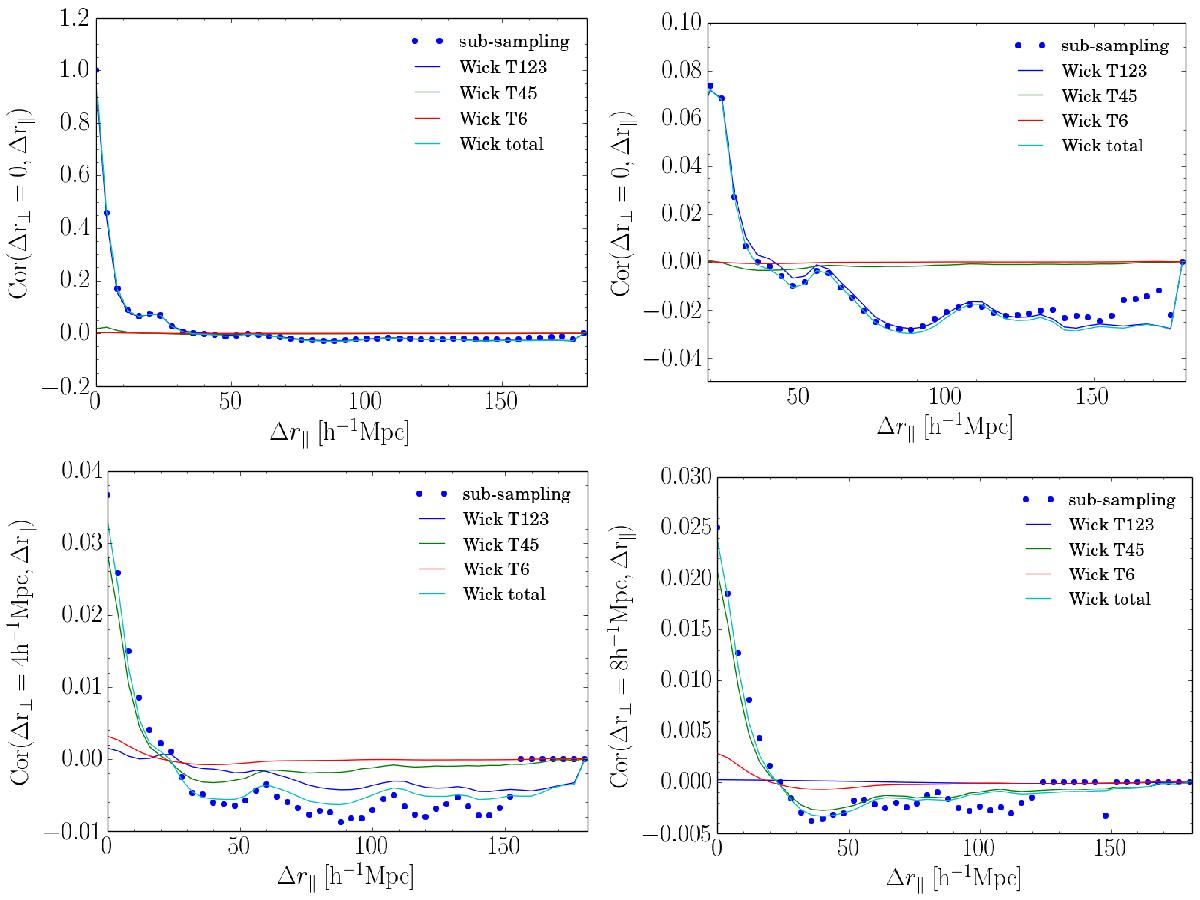
Correlation ![]() as a function of
as a function of ![]() (averaged over
(averaged over ![]() ). The top figures are for
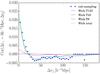
). The top figures are for ![]() over the full range of Δr∥ (left) and for Δr∥> 20 h-1 Mpc (right). The bottom two figures are for
over the full range of Δr∥ (left) and for Δr∥> 20 h-1 Mpc (right). The bottom two figures are for ![]() (left) and for
(left) and for ![]() (right). Shown are the correlations determined by sub-sampling and by a Wick expansion. The latter correlations are decomposed into the pair-of-pair types, T1–T6, as explained in Appendix A.
(right). Shown are the correlations determined by sub-sampling and by a Wick expansion. The latter correlations are decomposed into the pair-of-pair types, T1–T6, as explained in Appendix A.
Current usage metrics show cumulative count of Article Views (full-text article views including HTML views, PDF and ePub downloads, according to the available data) and Abstracts Views on Vision4Press platform.
Data correspond to usage on the plateform after 2015. The current usage metrics is available 48-96 hours after online publication and is updated daily on week days.
Initial download of the metrics may take a while.