Fig. 3
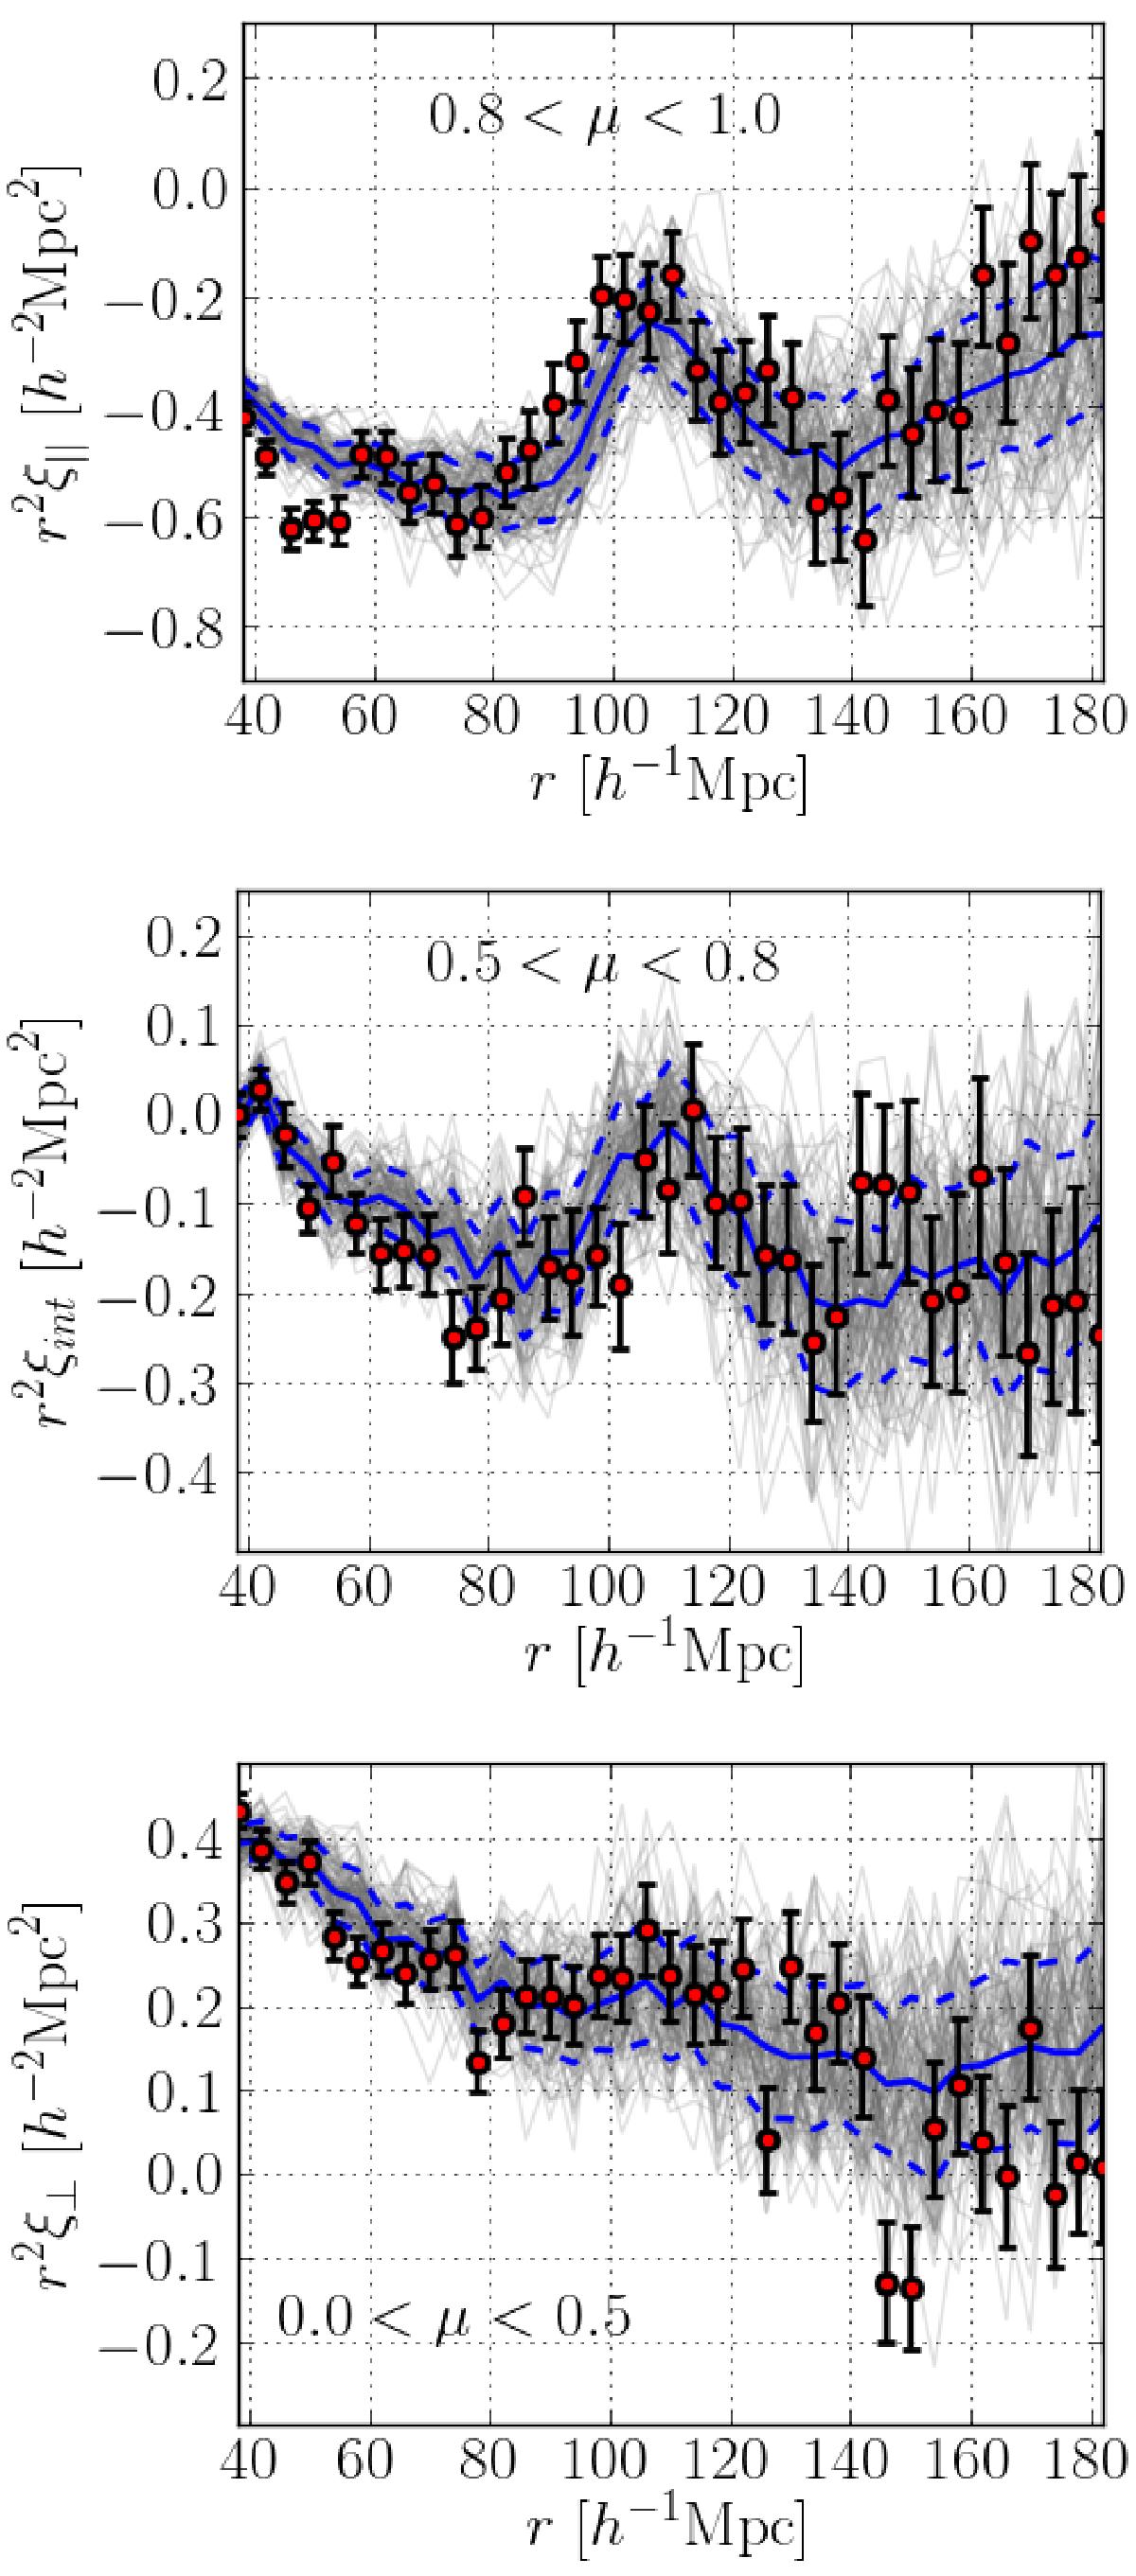
Measured correlation function averaged over three angular regions: μ> 0.8 (top), 0.8 >μ> 0.5 (middle), and 0.5 >μ> 0.0 (bottom), where μ is the central value of ![]() in each (r∥,r⊥) bin. The gray lines show individual sets of mocks, the solid blue line represents the mean of the 100 mock sets. The dashed blue lines are the 1σ variations of the mocks. The red points show the data.
in each (r∥,r⊥) bin. The gray lines show individual sets of mocks, the solid blue line represents the mean of the 100 mock sets. The dashed blue lines are the 1σ variations of the mocks. The red points show the data.
Current usage metrics show cumulative count of Article Views (full-text article views including HTML views, PDF and ePub downloads, according to the available data) and Abstracts Views on Vision4Press platform.
Data correspond to usage on the plateform after 2015. The current usage metrics is available 48-96 hours after online publication and is updated daily on week days.
Initial download of the metrics may take a while.