Free Access
Fig. 12
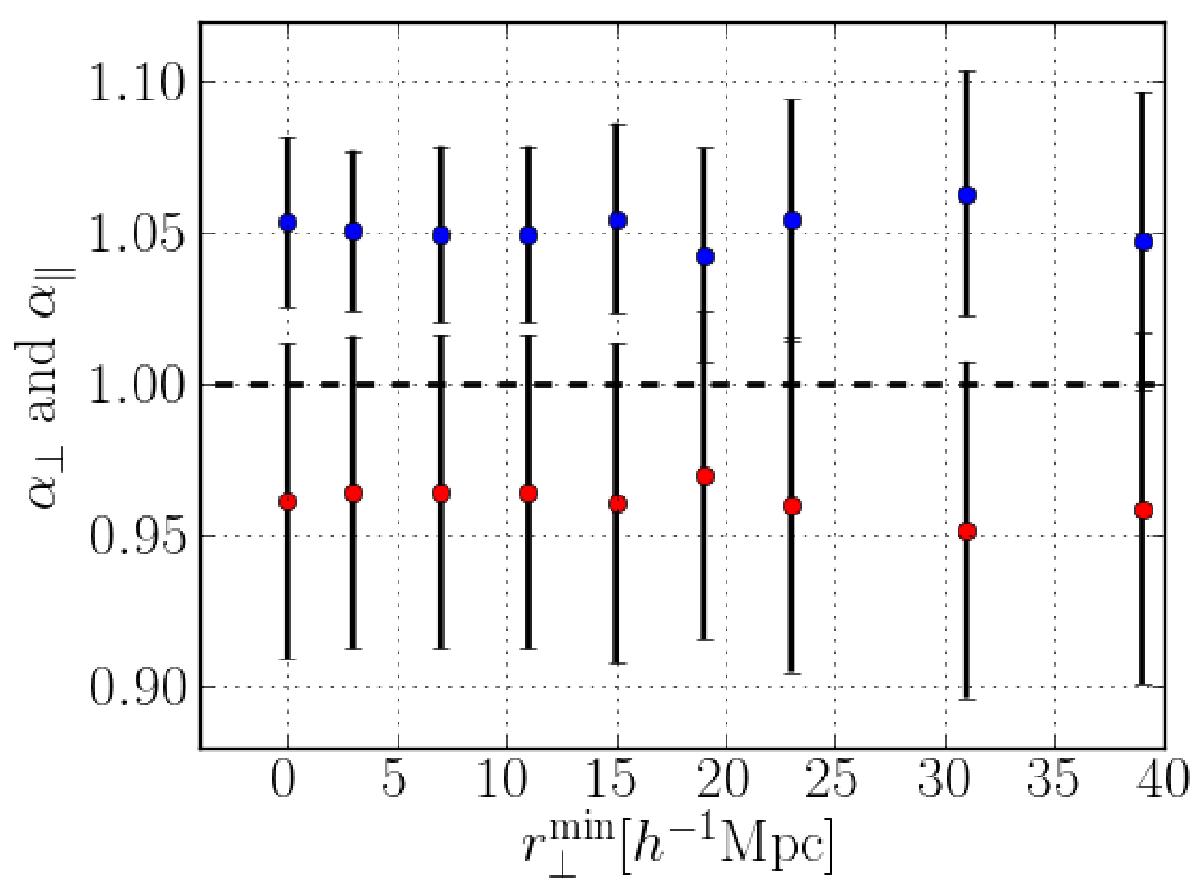
Values α∥ (blue dots) and α⊥ (red dots) recovered from the DR11 data for different choices of the minimum transverse separation, ![]() , used in the fit. The measured values do not change significantly when eliminating the small r⊥ bins that may be contaminated by correlations due to absorption by metals.
, used in the fit. The measured values do not change significantly when eliminating the small r⊥ bins that may be contaminated by correlations due to absorption by metals.
Current usage metrics show cumulative count of Article Views (full-text article views including HTML views, PDF and ePub downloads, according to the available data) and Abstracts Views on Vision4Press platform.
Data correspond to usage on the plateform after 2015. The current usage metrics is available 48-96 hours after online publication and is updated daily on week days.
Initial download of the metrics may take a while.