Fig. 11
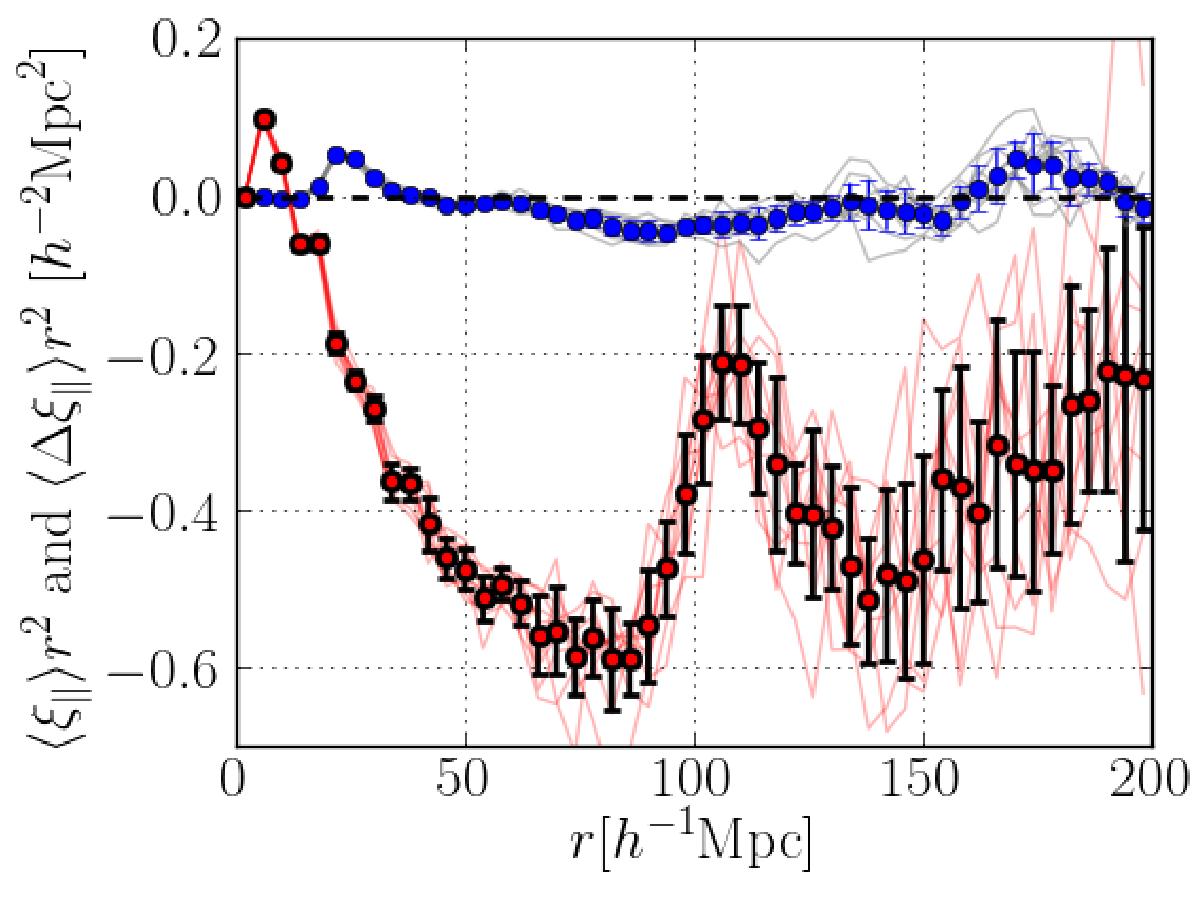
Effect of metals on the measured correlation function for 10 mock sets. The red circles show r2ξ(r) for μ> 0.8 averaged over the 10 mock sets The blue circles show the difference between r2ξ(r) and r2ξ(r) in the same mock realization, but without metals. The light red and blue lines show the results for individual mock sets, the error bars give the standard deviation of the 10 realizations.
Current usage metrics show cumulative count of Article Views (full-text article views including HTML views, PDF and ePub downloads, according to the available data) and Abstracts Views on Vision4Press platform.
Data correspond to usage on the plateform after 2015. The current usage metrics is available 48-96 hours after online publication and is updated daily on week days.
Initial download of the metrics may take a while.