Free Access
Fig. 1
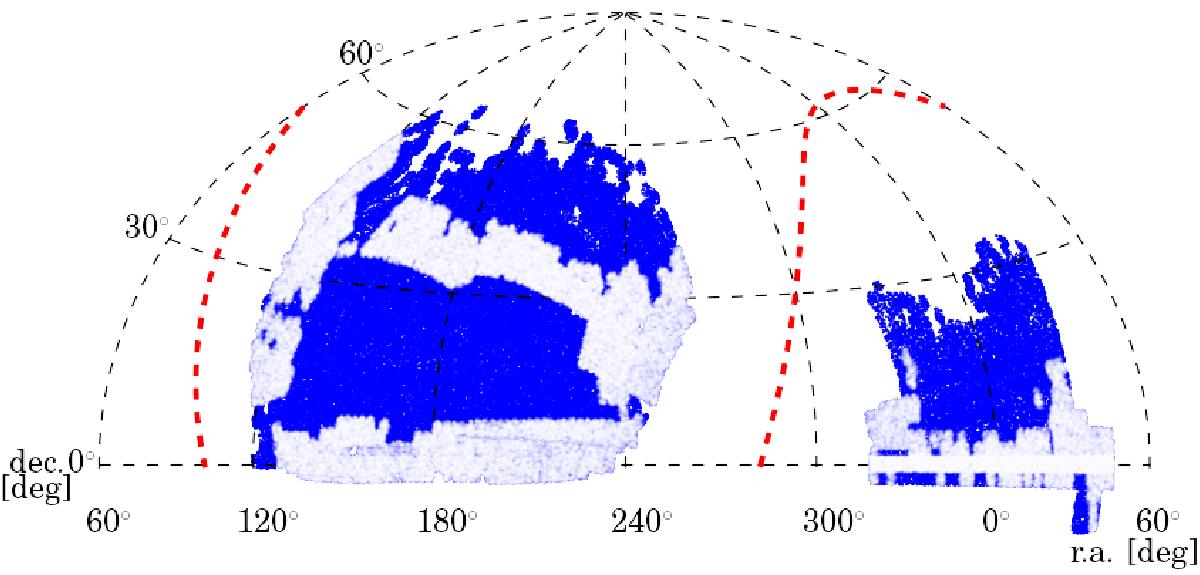
Hammer-Aitoff projection of the BOSS DR11 footprint (Dec vs. RA). The light areas show the DR9 subregion available for the earlier studies of Busca et al. (2013) and Slosar et al. (2013). The red-dashed line shows the location of the galactic plane.
Current usage metrics show cumulative count of Article Views (full-text article views including HTML views, PDF and ePub downloads, according to the available data) and Abstracts Views on Vision4Press platform.
Data correspond to usage on the plateform after 2015. The current usage metrics is available 48-96 hours after online publication and is updated daily on week days.
Initial download of the metrics may take a while.