Fig. 6
Probability ![]() of finding the true polarization fraction p0 inside the interval
of finding the true polarization fraction p0 inside the interval ![]() , where
, where ![]() and
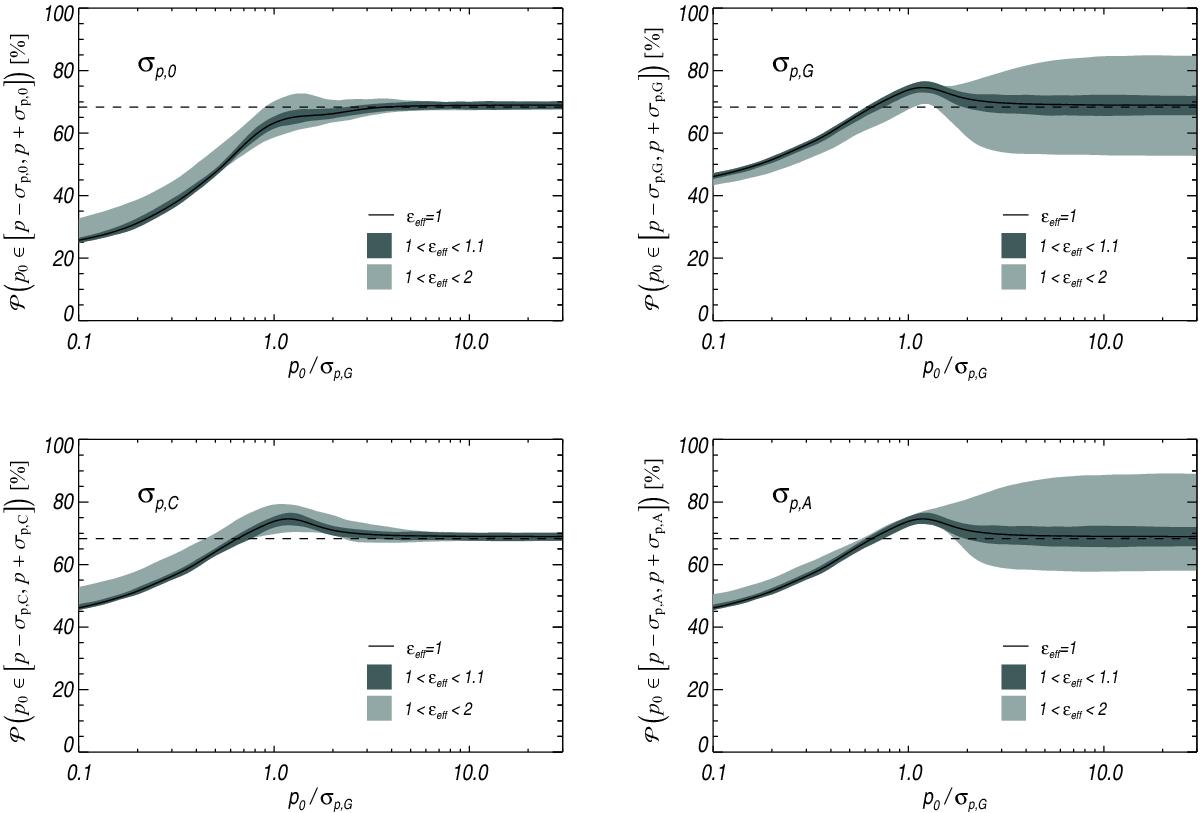
and ![]() are the 1σ lower and upper limits, respectively. We plot this for each estimator: true σp,0 (top left); conventional σp,C (bottom left); geometric σp,G (top right); and arithmetic σp,A (bottom right). These are plotted as a function of the S/N p0/σp,G. Monte Carlo simulations have been carried out in the canonical (solid line), low (dark grey), and extreme (light grey) regimes of the covariance matrix. The expected 68.27% level is shown as a dashed line.
are the 1σ lower and upper limits, respectively. We plot this for each estimator: true σp,0 (top left); conventional σp,C (bottom left); geometric σp,G (top right); and arithmetic σp,A (bottom right). These are plotted as a function of the S/N p0/σp,G. Monte Carlo simulations have been carried out in the canonical (solid line), low (dark grey), and extreme (light grey) regimes of the covariance matrix. The expected 68.27% level is shown as a dashed line.
Current usage metrics show cumulative count of Article Views (full-text article views including HTML views, PDF and ePub downloads, according to the available data) and Abstracts Views on Vision4Press platform.
Data correspond to usage on the plateform after 2015. The current usage metrics is available 48-96 hours after online publication and is updated daily on week days.
Initial download of the metrics may take a while.