Fig. 3
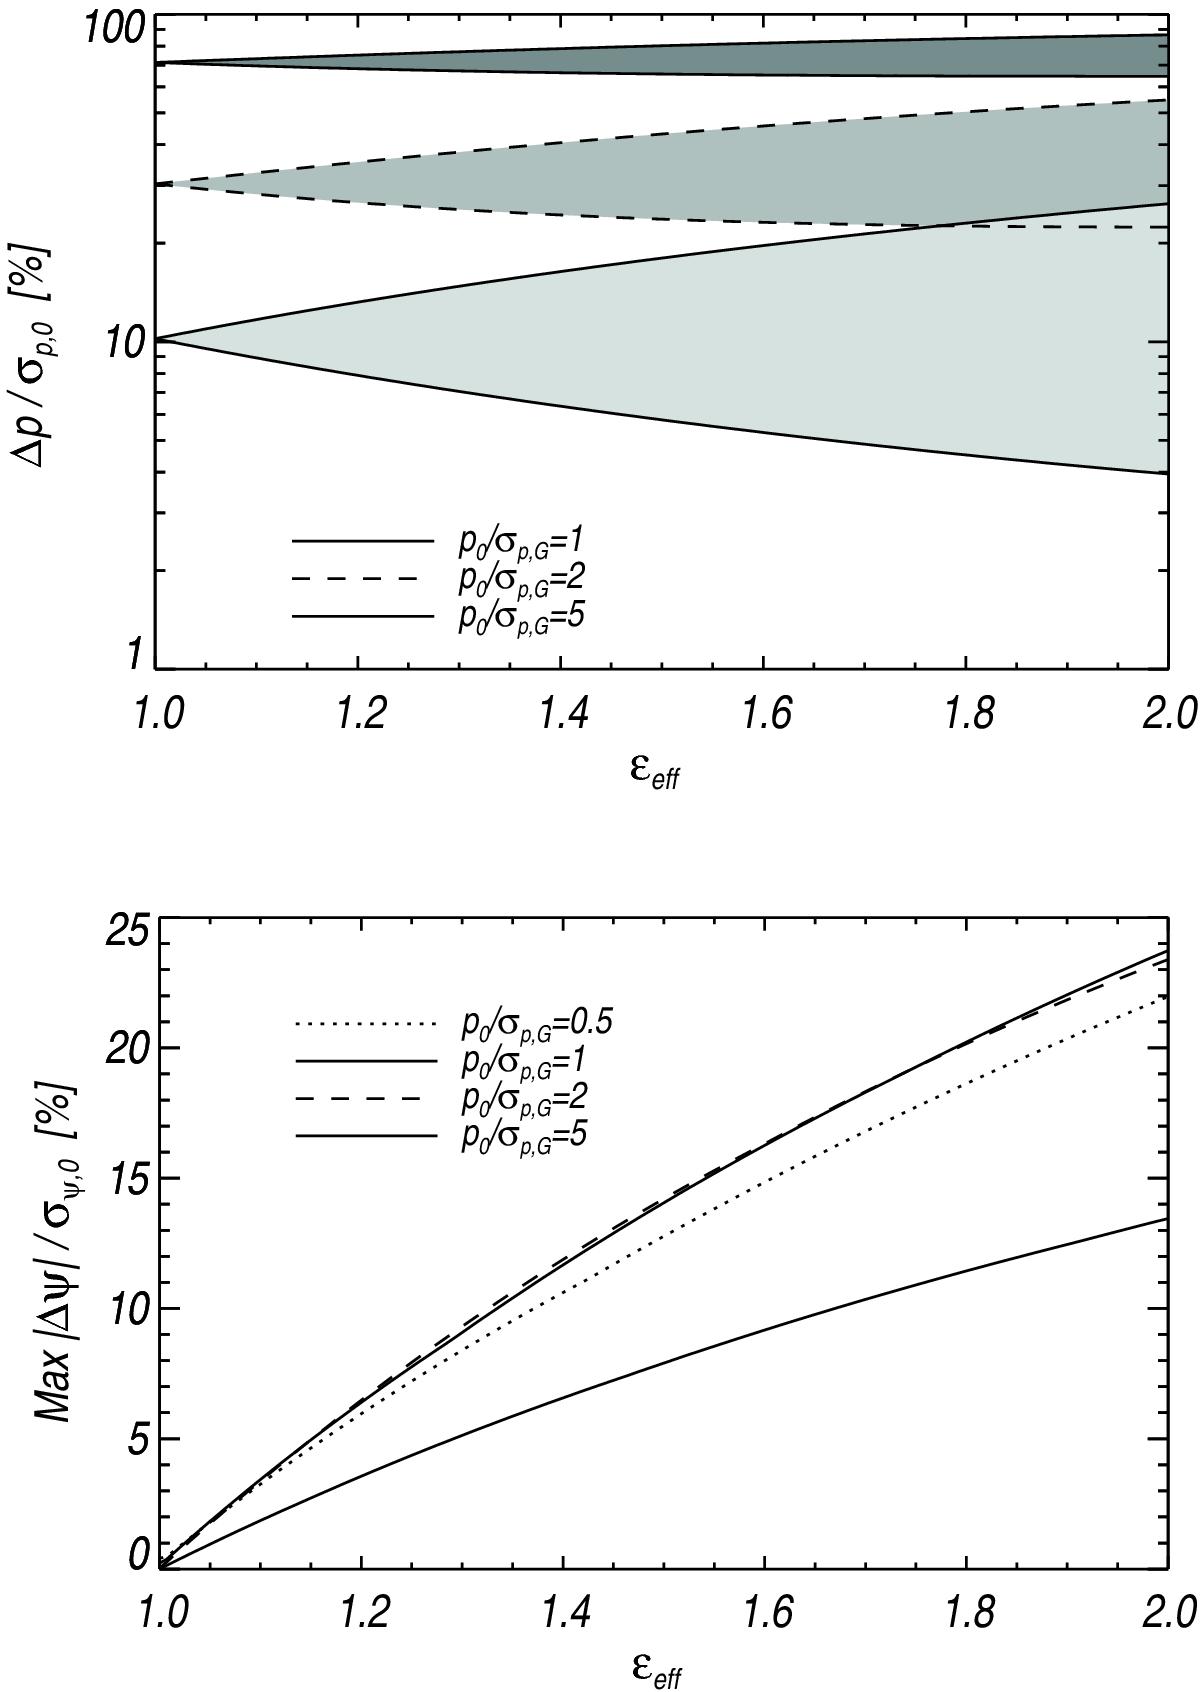
Impact of the effective ellipticity εeff on the levels of bias. Top: Δp/σp,0 as a function of the effective ellipticity εeff, displayed for three levels of the S/N, p0/σp,G = 1, 2, and 5. The grey shaded regions indicate the whole extent of variability due to ψ0 and θ spanning the range − π/ 2 to π/ 2. Bottom: maximum | Δψ | /σψ,0 value for ψ0 and θ spanning the range − π/ 2 to π/ 2, plotted as a function of the effective ellipticity εeff, displayed for four levels of the S/N, p0/σp,G = 0.5, 1, 2, and 5.
Current usage metrics show cumulative count of Article Views (full-text article views including HTML views, PDF and ePub downloads, according to the available data) and Abstracts Views on Vision4Press platform.
Data correspond to usage on the plateform after 2015. The current usage metrics is available 48-96 hours after online publication and is updated daily on week days.
Initial download of the metrics may take a while.