| Issue |
A&A
Volume 573, January 2015
|
|
|---|---|---|
| Article Number | L3 | |
| Number of page(s) | 4 | |
| Section | Letters | |
| DOI | https://doi.org/10.1051/0004-6361/201425211 | |
| Published online | 18 December 2014 | |
AGC198606: A gas-bearing dark matter minihalo?
1
Netherlands Institute for Radio Astronomy (ASTRON),
Postbus 2, 7900 AA
Dwingeloo, The
Netherlands
e-mail: This email address is being protected from spambots. You need JavaScript enabled to view it.
2
Raymond and Beverly Sackler School of Physics and Astronomy, Tel
Aviv University, Ramat
Aviv
69978,
Israel
3
Department of Astronomy, Indiana University,
727 East Third Street,
Bloomington, IN
47405,
USA
4
Kapteyn Astronomical Institute, University of
Groningen, Postbus
800, 9700 AA
Grongingen, The
Netherlands
5
Center for Radiophysics and Space Research, Space Sciences
Building, Cornell University, Ithaca, NY
14853,
USA
6
Department of Physics and Astronomy, Macalaster College, 1600 Grand Avenue,
Saint Paul, MN
55105,
USA
7
Departamento de Astronomía, Universidad de Chile,
Casilla 36-D, Santiago, Chile
Received:
24
October
2014
Accepted:
24
November
2014
Abstract
We present neutral hydrogen (H i) imaging observations with the Westerbork Synthesis Radio Telescope of AGC198606, an H i cloud discovered in the ALFALFA 21cm survey. This object is of particular note as it is located 16 km s-1 and 1.̊2 from the gas-bearing ultra-faint dwarf galaxy Leo T while having a similar H i linewidth and approximately twice the flux density. The H i imaging observations reveal a smooth, undisturbed H i morphology with a full extent of 23′ × 16′ at the 5 × 10¹⁸ atoms cm-2 level. The velocity field of AGC198606 shows ordered motion with a gradient of ~25 km s-1 across ~20′. The global velocity dispersion is 9.3 km s-1 with no evidence for a narrow spectral component. No optical counterpart to AGC198606 is detected. The distance to AGC198606 is unknown, and we consider several different scenarios: physical association with Leo T, a minihalo at a distance of ~150 kpc based on the models of Faerman et al. (2013, ApJ, 777, 119), and a cloud in the Galactic halo. At a distance of 420 kpc, AGC198606 would have an H i mass of 6.2 × 10⁵ M⊙, an H i radius of 1.4 kpc, and a dynamical mass within the H i extent of 1.5 × 10⁸ M⊙.
Key words: galaxies: dwarf / galaxies: ISM / local group / radio lines: galaxies
© ESO, 2014
1. Introduction
While ΛCDM provides an overall successful theoretical framework for understanding the observations of galaxy clustering, properties, and evolution, large discrepancies have been noted between the predicted number of low-mass dark matter (DM) halos and the abundance of observed dwarf galaxies (e.g., Klypin et al. 1999). This is generally attributed to the inability of halos to retain their baryons, which increases progressively with decreasing halo mass (Kravtsov 2010). The interesting question thus arises: what is the smallest mass halo capable of hosting an observable baryonic counterpart? The discovery of ultra-faint dwarf galaxies (UFDs) around the Milky Way (MW) highlights that galaxies with minimal stellar components (Mstar ≲ 103 M⊙) can exist. However, it is not clear whether their small stellar populations are the result of evolution or interaction with the MW (e.g., McConnachie 2012; Muñoz et al. 2010).
Following the pattern of morphological segregation, gas-rich dwarf systems are seen prevalently in the periphery of the Local Group (Grebel 1999). This pattern continues with the UFDs; the most distant UFD (Leo T; d = 420 kpc) is the only one with detected H i(Spekkens et al. 2014). In a variation of the idea previously proposed by Blitz et al. (1999) and Braun & Burton (1999), we proposed in Giovanelli et al. (2010) that gas-rich low-mass halos may be detected in the H i 21cm line as ultra-compact high velocity clouds (UCHVCs). Using the ALFALFA survey data (Giovanelli et al. 2005), we presented a catalog of UCHVCs (Adams et al. 2013) as potential minihalo candidates, consistent with the models of Faerman et al. (2013, hereafter F13) for gas in low-mass DM halos (see also Sternberg et al. 2002). The discovery of the extremely metal-poor, star-forming dwarf galaxy Leo P via its H i content in the ALFALFA survey validates the idea that gas-rich galaxies within the Local Group or its immediate environs can be identified via this tracer (Giovanelli et al. 2013; Rhode et al. 2013; Skillman et al. 2013).
The ALFALFA source AGC198606 has properties quite similar to those of the Adams et al. (2013) UCHVCs, except for its radial velocity (cz⊙ = 51 km s-1), which is lower than the cutoff used in that work. Its similarity to the properties of the H i component of Leo T and nearby location (separated by  and 16 km s-1) was noted by RG and MPH, and thus it received the nickname “friend of Leo T”. In this paper we explore the possibility that AGC198606 is a system similar to Leo T and Leo P, except for having a less substantial stellar population.
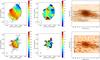 |
Fig. 1 H i spatial and kinematic information for AGC198606. Upper row: WSRT data at 210′′ resolution. Lower row: WSRT data at 105′′ resolution. Left column: velocity field from Gaussian fitting to 4.2 km s-1 spectral data cubes with H i column density contours overlaid. The contours are [0.5, 0.75, 1.5, 2.5, 4] and [1.25, 1.75, 2.5, 3.5, 5] × 1019 atoms cm-2 for the 210′′ (upper) and 105′′ (lower) data. Middle column: velocity dispersion map of AGC198606 from the Gaussian fitting. Contours show lines of constant velocity from the velocity fields (left) and are at values of [41, 43.5, 46, 48.5, 51, 53.5, 56] km s-1. Right column: position-velocity slice along the major axis (shown in left panels). Contours are spaced at 3σ; for the 210′′ and 105′′ data σ is 2.11 and 1.07 mJy beam-1. The dashed line is the recessional velocity cz = 50.9 km s-1; the solid lines are offset by ± 12.5 km s-1. |
2. Data
2.1. WSRT HI data
The H i in AGC198606 was observed using two 12-h tracks with the Westerbork Synthesis Radio Telescope (WSRT) in June 2013 and January 2014. The spectral setup was a 10 MHz bandwidth divided into 2048 channels, providing a nominal velocity resolution of 1 km s-1. Standard data calibration and reduction was undertaken in Miriad (Sault et al. 1995); imaging was done in CASA1. AGC198606 is a low surface brightness object, so the data were tapered to lower spatial resolution and binned in velocity to increase the signal-to-noise ratio. AGC198606 was imaged at 210′′ resolution (ALFALFA spatial resolution), 105′′ resolution, and 60′′ resolution. At resolutions higher than 60′′, the full flux of the system is no longer recovered.
A single-channel image (Δv = 46 km s-1) was created for each spatial resolution and used to isolate the emission; this was used as an input mask for cleaning spectral data cubes with a velocity resolution of 4.2 km s-1. The observed total flux density is 14.8 ± 1.5 Jy km s-1. Contours from the total intensity H i maps at 210′′ and 105′′ resolution are shown in the left column of Fig. 1. AGC198606 is roughly circular in the inner extent with the outer envelope showing elongation in the north-south direction. At 210′′ resolution, the outermost H i extent (5 × 10¹⁸ atoms cm-2) is 23′ × 16′. The half-flux radius is 5.́5 ± 0.́5, and the peak column density at 60′′ resolution is 6 × 10¹⁹ atoms cm-2.
The kinematics of AGC198606 were studied by fitting Gaussians to spectral data cubes where the signal was above the 5-σ level. The resulting velocity fields and position-velocity slices (left and right columns of Fig. 1, respectively) show a velocity gradient of ~25 km s-1 across ~20′, aligned with the major axis of the H i emission. The turn-over in the velocity gradient at the southern edge of the 210′′ velocity field is a result of diffuse emission at low velocities (including minor contamination from Galactic H i, which we estimate to contribute to the final H i flux integral at the ~1% level) affecting the fit. This is also seen as an increase in the velocity dispersion (upper middle of Fig. 1).
The velocity dispersion maps show that the velocity dispersion is at least 7 km s-1 across the full extent of AGC198606. To search for a narrow spectral component from the presence of cold neutral medium (CNM), the centers of the fitted Gaussians were used to shift the spectra at each pixel to the recessional velocity of AGC198606. The best fit to the resulting global spectrum is a single Gaussian with a velocity dispersion of 9.3 km s-1. There is no evidence for a multi-phase medium containing a CNM component, although a velocity dispersion as low as 2 km s-1 would be spectrally resolved.
AGC198606 global parameters.
From the WSRT data we can place lower limits on the dynamical mass within the H i extent, assuming AGC198606 is gravitationally bound. From Hoffman et al. (1996) we adopt  (1)Assuming there is no rotation and that the global W50 represents the dynamics of the system, we find a lower limit to the dynamical mass of 2.5 × 10⁸dMpc M⊙. The alignment of the velocity gradient with the major axis of the H i emission and the clear structure in the position-velocity slices (seen in Fig. 1), are indicative of rotation with an uncorrected amplitude of ~12.5 km s-1. The inclination of AGC198606 is estimated from the H i data to be 64°; then the rotation velocity is ~14 km s-1. For an intrinsic velocity dispersion of 9.3 km s-1, the lower limit to the dynamical mass then increases to 3.5 × 10⁸dMpc M⊙. Varying the rotation velocity from [ 12.5−20 ] km s-1 results in a dynamical mass range of [ 3.2−5.1 ] × 108dMpc M⊙.
2.2. WIYN data
Deep observations of AGC198606 were taken on 15 March 2013 with the partially populated One Degree Imager (pODI; ~ 24′ × 24′ field of view) on the WIYN 3.5 m telescope2 at Kitt Peak National Observatory3, as part of a larger observing program aimed at characterizing the stellar populations of the UCHVCs (Janesh et al., in prep). Nine 300-s exposures were obtained in a dither pattern in both the SDSS g′ and i′ filters.
The WIYN pODI images were transferred to the ODI Pipeline, Portal, and Archive (ODI-PPA)4 at Indiana University and processed with the QuickReduce data reduction pipeline (Kotulla 2014). The reduced images were reprojected onto a common pixel scale, scaled to a common flux level, and combined to create a deep stacked image in each filter. SDSS stars present in the images were used to calculate photometric calibration coefficients for converting instrumental magnitudes to calibrated values; errors on the zero points were <0.02 mag.
The final mean FWHM of point sources is 0.72′′ in the stacked g′ image and 0.78′′ in the stacked i′ image. The 5σ limit on the brightness of a point source in the g′-band image is g′ = 25.3. For the i′ image, the corresponding 5σ limit is i′ = 24.6. We searched for an optical counterpart by first detecting all sources in the images above a modest (~4σ) signal-to-noise threshold, performing photometry on the detected sources, removing extended objects, applying a color–magnitude filter based on the expected stellar population for a range of distances from 0.16−2.5 Mpc, and implementing a smoothing algorithm to determine whether there is an overdensity of stars in the set of filtered objects. The pODI images and our search process reveal no obvious stellar counterpart for AGC198606. To estimate an upper limit for the total optical luminosity associated with AGC198606, we masked out bright foreground stars and obvious background galaxies in the combined i′-band image. We then measured the total sky-subtracted flux in an aperture of radius equal to the half-light radius of Leo T (1.4′; Irwin et al. 2007), centered on the H i centroid in Table 1. The measured i′-band flux within this aperture yields a limit to the total apparent magnitude of mi′ ≃ 16.5. At the distance of Leo T (420 kpc), this corresponds to an absolute magnitude of Mi′ ≃ −6.6. Note that the measured apparent magnitude includes light from stars faint enough to be in a dwarf galaxy at this distance as well as light from any unmasked background galaxies. Further details of our search methods will be presented in Janesh et al. (in prep.).
3. Nature of AGC198606
In this section we discuss two possible scenarios for AGC198606: that it is a gas-bearing minihalo or part of the population of H i clouds in the Galactic halo.
3.1. Gas-bearing minihalo
At the distance of Leo T (420 kpc), AGC198606 would have an H i mass of 6.2 × 10⁵ M⊙, an H i radius at the 2 × 10¹⁹ atoms cm-2 level of 600 pc, a full H i extent of 2.8 × 2.0 kpc, and a dynamical mass within the full H i extent of 1.5 × 10⁸ M⊙. Leo T has a stellar mass of 1.2 × 10⁵ M⊙, an H i mass of 2.8 × 10⁵ M⊙, an H i radius of 300 pc (at the 2 × 10¹⁹ atoms cm-2 level), and an indicative dynamical mass (based on Eq. (1)) of ~1 × 10⁷ M⊙(Ryan-Weber et al. 2008). AGC198606 would have about twice the H i mass and size as Leo T, but its peak H i column density is significantly lower, potentially explaining the apparent lack of a stellar counterpart. In this scenario, the two systems would have a projected separation of 8.4 kpc and could be a bound pair of satellites similar to Leo IV and Leo V (de Jong et al. 2010). The ALFALFA data do not reveal H i emission connecting AGC198606 to Leo T; low-level emission connecting the two cannot be ruled out as Leo T lies at the same velocity as strong foreground Galactic H i emission.
Applying the models from F13 for a flux density of 14.8 Jy km s-1, a half-flux radius of 5.́5, and a peak column density of 6 × 10¹⁹ atoms cm-2 gives a distance estimate of 120−180 kpc for a typical flat-cored halo. At a distance of 150 kpc, AGC198606 would have an H i mass of 7.9 × 10⁴ M⊙, an H i half-flux radius of 240 pc, a full H i extent of 1.0 × 0.70 kpc, and a dynamical mass of 5.3 × 10⁷ M⊙. These H i properties are similar to those of Leo T, and the H i kinematics are similar to Leo P. H i imaging observations of Leo P reveal a rotational velocity of 15 km s-1 at an H i radius of 500 pc (Bernstein-Cooper et al. 2014). With less H i than Leo T and no CNM (seen in both Leo T and Leo P), the lack of a clear stellar component is understandable. However, at this close distance, the question arises of how a small object could retain its H i gas in the presence of the MW’s hot corona.
The baryonic Tully-Fisher relation (BTFR) relates baryonic mass to rotational velocity over five orders of magnitude (McGaugh 2012). Figure 2 shows the BTFR from McGaugh (2012) with AGC198606 overplotted based on its total atomic gas mass (1.33 × MHI to account for helium) for the two distances considered above. In both cases, it lies below the canonical BTFR, although the Leo T scenario is consistent with the scatter at low velocities. In order for AGC198606 to fall on the canonical BTFR based solely on its atomic gas mass, it would need to be at a distance of 620 kpc (Mgas = 1.8 × 10⁶ M⊙). At this distance, it would have an H i diameter of 4.1 kpc, ~4 times greater than expected for its H i mass (Begum et al. 2008); the lack of a stellar counterpart for such a system would be exceptionally rare.
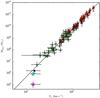 |
Fig. 2 Baryonic Tully-Fisher relation from McGaugh (2012, black line) shown with the data points of McGaugh (2012, green triangles) and McGaugh (2005, red circles). Leo P is shown as the black square (Bernstein-Cooper et al. 2014). AGC198606 is shown at 420 kpc (cyan star) and 150 kpc (magenta star). |
3.2. Galactic halo HI cloud
Alternatively, AGC198606 could be a nearby gas cloud associated with the Galactic halo. For a representative distance of ~10 kpc, it would have an H i mass of 350 M⊙ and an H i size of 67 × 47 pc. High-resolution H i observations of compact Galactic halo clouds generally reveal an irregular morphology, often consisting of several small cores with narrow velocity widths at scales of a few arcminutes (e.g., de Heij et al. 2002; Brüns & Westmeier 2004). In contrast, the H i morphology of AGC198606 remains rather smooth and undisturbed down to the imaging limits, and there is no evidence for cold condensations of gas. While we cannot rule this scenario out, the H i morphology and kinematics of AGC198606 are not a good match to previous observations of Galactic halo clouds.
4. Summary
AGC198606 is a compact H i cloud identified within the ALFALFA H i survey. It is of particular interest as it is near the gas-bearing UFD Leo T spatially and kinematically, and it has similar H i properties as measured by the single-dish ALFALFA survey. This makes it an excellent candidate to represent a (nearly) starless gas-bearing DM halo. Imaging observations with WSRT show that AGC198606 has an H i mass of  M⊙, an H i radius of 3.3 dMpc kpc, and an ordered velocity gradient of ~25 km s-1 along the H i major axis. Deep optical imaging with the WIYN 3.5m telescope reveal no obvious stellar counterpart; future work will quantify the stellar population that could be detected in these images (Janesh et al. in prep). Without the direct identification of a stellar counterpart to constrain the distance to AGC198606, its true nature remains uncertain, and we discussed several plausible distances for AGC198606. If physically associated with Leo T, AGC198606 would have about twice the H i mass and size. Alternatively, it could be at a closer distance of 150 kpc suggested by the models in F13. The H i morphology of AGC198606 is different from observations of clouds in the Galactic halo with no evidence for cores, although they could exist at scales smaller than 60′′. H i imaging observations of other UCHVCs will offer further context for the UCHVCs and help determine whether the H i structure of AGC198606 is different from that of Galactic halo clouds.
Common Astronomy Software Applications (CASA) is developed and maintained by the National Radio Astronomy Observatory.
The WIYN Observatory is a joint facility of the University of Wisconsin-Madison, Indiana University, the University of Missouri, and the National Optical Astronomy Observatory.
Kitt Peak National Observatory, part of the National Optical Astronomy Observatory, is operated by the Association of Universities for Research in Astronomy (AURA) under a cooperative agreement with the National Science Foundation.
The ODI Pipeline, Portal, and Archive (ODI-PPA) system is a joint development project of the WIYN Consortium, Inc., in partnership with Indiana University’s Pervasive Technology Institute (PTI) and with the National Optical Astronomy Observatory Science Data Management (NOAO SDM) Program.
Acknowledgments
We thank the anonymous referee for valuable input. The Westerbork Synthesis Radio Telescope is operated by the ASTRON (Netherlands Institute for Radio Astronomy) with support from the Netherlands Foundation for Scientific Research (NWO). The ALFALFA work at Cornell is supported by NSF grants AST-0607007 and AST-1107390 to R.G. and M.P.H. and by grants from the Brinson Foundation. K.L.R. and W.F.J. acknowledge support from NSF CAREER award AST-0847109. J.M.C. is supported by NSF grant AST-1211683. R. R. M. acknowledges partial support from CONICYT Anillo project ACT-1122 and project BASAL PFB-06 as well as FONDECYT project N°1120013.
References
- Adams, E. A. K., Giovanelli, R., & Haynes, M. P. 2013, ApJ, 768, 77 [NASA ADS] [CrossRef] [Google Scholar]
- Begum, A., Chengalur, J. N., Karachentsev, I. D., Sharina, M. E., & Kaisin, S. S. 2008, MNRAS, 386, 1667 [NASA ADS] [CrossRef] [Google Scholar]
- Bernstein-Cooper, E. Z., Cannon, J. M., Elson, E. C., et al. 2014, AJ, 148, 35 [NASA ADS] [CrossRef] [Google Scholar]
- Blitz, L., Spergel, D. N., Teuben, P. J., Hartmann, D., & Burton, W. B. 1999, ApJ, 514, 818 [NASA ADS] [CrossRef] [Google Scholar]
- Braun, R., & Burton, W. B. 1999, A&A, 341, 437 [NASA ADS] [Google Scholar]
- Brüns, C., & Westmeier, T. 2004, A&A, 426, L9 [NASA ADS] [CrossRef] [EDP Sciences] [Google Scholar]
- de Heij, V., Braun, R., & Burton, W. B. 2002, A&A, 391, 67 [NASA ADS] [CrossRef] [EDP Sciences] [Google Scholar]
- de Jong, J. T. A., Martin, N. F., Rix, H.-W., et al. 2010, ApJ, 710, 1664 [NASA ADS] [CrossRef] [Google Scholar]
- Faerman, Y., Sternberg, A., & McKee, C. F. 2013, ApJ, 777, 119 [NASA ADS] [CrossRef] [Google Scholar]
- Giovanelli, R., Haynes, M. P., Kent, B. R., et al. 2005, AJ, 130, 2598 [NASA ADS] [CrossRef] [Google Scholar]
- Giovanelli, R., Haynes, M. P., Kent, B. R., & Adams, E. A. K. 2010, ApJ, 708, L22 [NASA ADS] [CrossRef] [Google Scholar]
- Giovanelli, R., Haynes, M. P., Adams, E. A. K., et al. 2013, AJ, 146, 15 [NASA ADS] [CrossRef] [Google Scholar]
- Grebel, E. K. 1999, in The Stellar Content of Local Group Galaxies, eds. P. Whitelock, & R. Cannon, IAU Symp., 192, 17 [Google Scholar]
- Hoffman, G. L., Salpeter, E. E., Farhat, B., et al. 1996, ApJS, 105, 269 [NASA ADS] [CrossRef] [Google Scholar]
- Irwin, M. J., Belokurov, V., Evans, N. W., et al. 2007, ApJ, 656, L13 [NASA ADS] [CrossRef] [MathSciNet] [Google Scholar]
- Klypin, A., Kravtsov, A. V., Valenzuela, O., & Prada, F. 1999, ApJ, 522, 82 [Google Scholar]
- Kotulla, R. 2014, in Astronomical Data Anaylsis Softward and Systems XXIII, eds. N. Manset, & P. Forshay, ASP Conf. Ser., 485, 375 [Google Scholar]
- Kravtsov, A. 2010, Adv. Astron., 2010, 8 [Google Scholar]
- McConnachie, A. W. 2012, AJ, 144, 4 [NASA ADS] [CrossRef] [Google Scholar]
- McGaugh, S. S. 2005, ApJ, 632, 859 [NASA ADS] [CrossRef] [Google Scholar]
- McGaugh, S. S. 2012, AJ, 143, 40 [NASA ADS] [CrossRef] [Google Scholar]
- Muñoz, R. R., Geha, M., & Willman, B. 2010, AJ, 140, 138 [NASA ADS] [CrossRef] [Google Scholar]
- Rhode, K. L., Salzer, J. J., Haurberg, N. C., et al. 2013, AJ, 145, 149 [NASA ADS] [CrossRef] [Google Scholar]
- Ryan-Weber, E. V., Begum, A., Oosterloo, T., et al. 2008, MNRAS, 384, 535 [NASA ADS] [CrossRef] [Google Scholar]
- Sault, R. J., Teuben, P. J., & Wright, M. C. H. 1995, in Astronomical Data Analysis Software and Systems IV, eds. R. A. Shaw, H. E. Payne, & J. J. E. Hayes, ASP Conf. Ser., 77, 433 [Google Scholar]
- Skillman, E. D., Salzer, J. J., Berg, D. A., et al. 2013, AJ, 146, 3 [NASA ADS] [CrossRef] [Google Scholar]
- Spekkens, K., Urbancic, N., Mason, B. S., Willman, B., & Aguirre, J. E. 2014, ApJ, 795, L5 [NASA ADS] [CrossRef] [Google Scholar]
- Sternberg, A., McKee, C. F., & Wolfire, M. G. 2002, ApJS, 143, 419 [NASA ADS] [CrossRef] [Google Scholar]
All Tables
All Figures
|
Fig. 1 H i spatial and kinematic information for AGC198606. Upper row: WSRT data at 210′′ resolution. Lower row: WSRT data at 105′′ resolution. Left column: velocity field from Gaussian fitting to 4.2 km s-1 spectral data cubes with H i column density contours overlaid. The contours are [0.5, 0.75, 1.5, 2.5, 4] and [1.25, 1.75, 2.5, 3.5, 5] × 1019 atoms cm-2 for the 210′′ (upper) and 105′′ (lower) data. Middle column: velocity dispersion map of AGC198606 from the Gaussian fitting. Contours show lines of constant velocity from the velocity fields (left) and are at values of [41, 43.5, 46, 48.5, 51, 53.5, 56] km s-1. Right column: position-velocity slice along the major axis (shown in left panels). Contours are spaced at 3σ; for the 210′′ and 105′′ data σ is 2.11 and 1.07 mJy beam-1. The dashed line is the recessional velocity cz = 50.9 km s-1; the solid lines are offset by ± 12.5 km s-1. |
| In the text | |
|
Fig. 2 Baryonic Tully-Fisher relation from McGaugh (2012, black line) shown with the data points of McGaugh (2012, green triangles) and McGaugh (2005, red circles). Leo P is shown as the black square (Bernstein-Cooper et al. 2014). AGC198606 is shown at 420 kpc (cyan star) and 150 kpc (magenta star). |
| In the text | |
Current usage metrics show cumulative count of Article Views (full-text article views including HTML views, PDF and ePub downloads, according to the available data) and Abstracts Views on Vision4Press platform.
Data correspond to usage on the plateform after 2015. The current usage metrics is available 48-96 hours after online publication and is updated daily on week days.
Initial download of the metrics may take a while.