Fig. 1
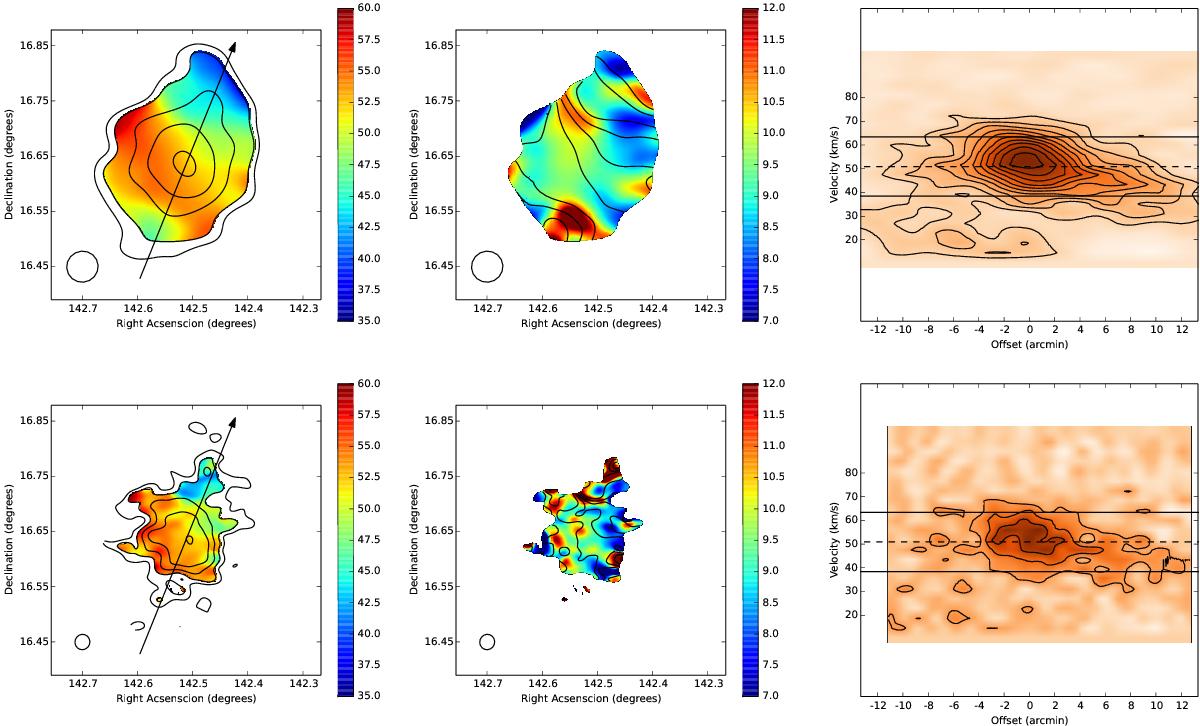
H i spatial and kinematic information for AGC198606. Upper row: WSRT data at 210′′ resolution. Lower row: WSRT data at 105′′ resolution. Left column: velocity field from Gaussian fitting to 4.2 km s-1 spectral data cubes with H i column density contours overlaid. The contours are [0.5, 0.75, 1.5, 2.5, 4] and [1.25, 1.75, 2.5, 3.5, 5] × 1019 atoms cm-2 for the 210′′ (upper) and 105′′ (lower) data. Middle column: velocity dispersion map of AGC198606 from the Gaussian fitting. Contours show lines of constant velocity from the velocity fields (left) and are at values of [41, 43.5, 46, 48.5, 51, 53.5, 56] km s-1. Right column: position-velocity slice along the major axis (shown in left panels). Contours are spaced at 3σ; for the 210′′ and 105′′ data σ is 2.11 and 1.07 mJy beam-1. The dashed line is the recessional velocity cz = 50.9 km s-1; the solid lines are offset by ± 12.5 km s-1.
Current usage metrics show cumulative count of Article Views (full-text article views including HTML views, PDF and ePub downloads, according to the available data) and Abstracts Views on Vision4Press platform.
Data correspond to usage on the plateform after 2015. The current usage metrics is available 48-96 hours after online publication and is updated daily on week days.
Initial download of the metrics may take a while.