| Issue |
A&A
Volume 573, January 2015
|
|
|---|---|---|
| Article Number | A15 | |
| Number of page(s) | 5 | |
| Section | Extragalactic astronomy | |
| DOI | https://doi.org/10.1051/0004-6361/201424848 | |
| Published online | 09 December 2014 | |
Research Note
Identifying AGN Balmer absorptions and stratified narrow emission-line region kinematics in SDSS J112611.63+425246.4
National Astronomical Observatories, Chinese Academy
of Sciences, 100012 Beijing, PR China
e-mail: This email address is being protected from spambots. You need JavaScript enabled to view it.
Received:
22
August
2014
Accepted:
21
October
2014
Abstract
Context. Balmer absorption is a rare phenomenon in active galactic nuclei (AGNs). So far, only seven Balmer-absorption AGNs have been reported in the literature.
Aims. We here report the identification of SDSS J112611.63+425246 as a new Balmer-absorption AGN through our spectral analysis and study the kinematics of its narrow emission-line region (NLR).
Methods. We modeled the continuum by a linear combination of a starlight component, a power law from the central AGN, and the emission from the FeII complex. After subtracting the modeled continuum, each emission or absorption line profile is a sum of multi-Gaussian functions. All the line shifts were determined with respect to the modeled starlight component.
Results. By using the host starlight as a reference for the local system, both Hα and Hβ show AGN absorptions with a blueshift of ~300 km s-1. We identify a strong anticorrelation between the inferred velocity shifts and the ionization potential for various narrow emission lines, which suggests a stratified NLR kinematics. A de-accelerated outflow is implied for the inner NLR gas, an accelerated inflow for the outer NLR gas. This complicated NLR kinematics additionally implies that AGN narrow emission lines, even for the low-ionized lines, might not be a reliable substitute for the velocity of the local system.
Key words: galaxies: active / galaxies: peculiar / galaxies: individual: SDSS J112611.63+425246.4
© ESO, 2014
1. Introduction
The feedback from a central active galactic nucleus (AGN) is now believed to be a potential key ingredient in understanding the coevolution of the AGN and its host galaxy. A widely accepted scenario is that the growth of a supermassive black hole (SMBH) regulates host star formation by sweeping out circumnuclear gas (e.g., Silk & Rees 1998; Somerville et al. 2008; Hirschmann et al. 2013; Di Matteo et al. 2007; Fabian 1999; Granato et al. 2004; Croton et al. 2006).
The evidence of outflow from an AGN on various scales has been identified in multiwavelength bands from radio to X-ray (see Veilleux et al. 2005 and Fabian 2012 for reviews). AGN outflow has been diagnosed by the blueshifted absorption lines. Although the narrow absorption lines with width ≤500 km s-1 are frequently identified in type I AGNs in UV and X-ray (~50%, e.g., Hamann & Sabra 2004), Balmer-absorption AGNs are still rare cases. So far, only seven Balmer-absorption AGNs are reported in the literature. They are NGC 4151 (Hutching et al. 2002), SDSS J0839+3805 (Aoki et al. 2006), SDSS J1259+1213 (Hall 2007), SDSS J1029+4500 (Wang et al. 2008), SDSS 1723+5553 (Aoki 2010), LBQS 1206+1052 (Ji et al. 2012), and SDSS J2220+0109 (Ji et al. 2013). Because of their rarity, the identification of more Balmer-absorption AGNs is essential for subsequently studying the nature of the AGN Balmer absorption-line region (BAR). First, recent studies pointed out that rigorous conditions with a high hydrogen column density of ~1021−22 cm-2 are required to excite neutral hydrogen atoms to n = 2 shell by Lyα resonant pumping (e.g., Ji et al. 2012). Second, the Balmer absorption lines can be used as a diagnostic for the kinematics of the natural gas around central AGNs.
In this paper, we report a detailed spectroscopic analysis for SDSS J112611.63+425246.4 (hereafter SDSS J1126+4252 for short)1, which allows us to identify the object as a new Balmer-absorption AGN and to identify a stratified kinematics in its narrow emission-line region (NLR) with respect to the systematic velocity determined from the host galaxy.
2. Spectral analysis
The optical spectrum of SDSS J1126+4252 was extracted when we carried out a systematic X-ray and optical spectral analysis on the XMM-Newton 2XMMi/SDSS-DR7 catalog that was originally cross-matched by Pineau et al. (2011). The catalog contains a total of more than 30 000 X-ray point-like sources (with an X-ray position accuracy ≤5″) that have an SDSS-DR7 optical counterpart with an identification probability higher than 90%. The spectrum of the object was taken by the SDSS dedicated 2.5 m wide-field telescope on February 27, 2004.
The one-dimensional spectrum of the object was analyzed with the IRAF2 package, including Galactic extinction correction, transformation to the rest frame, starlight component removal, and emission and absorption line profiling. We at first corrected the Galactic extinction for the color excess E(B − V) taken from the Galactic reddening map of Schlegel, Finkbeiner, and Davies (Schlegel et al. 1998), by assuming an RV = 3.1 extinction law of the Milky Way (Cardelli et al. 1989). The spectrum was then de-redshifted to its rest frame, along with the flux correction due to the relativity effect basing upon the measured redshift provided by the SDSS pipelines. The object has a nominal redshift of z = 0.15592 ± 0.00121, which corresponds to a velocity uncertainty of 363 km s-1.
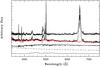 |
Fig. 1 Illustration of the modeling and removal of the continuum. The continuum-subtracted emission-line spectrum is shown by the top curve. Below the emission-line spectrum, the modeled continuum is overplotted by the red curve on the observed spectrum. The modeled continuum is obtained by a linear combination of a starlight component, a power law continuum from the AGN, and the emission from the FeII complex, which are displayed in ordinals below the observed spectrum. All the spectra are shifted vertically by an arbitrary amount for visibility. |
The total light spectrum at the rest frame is displayed in Fig. 1. It shows that there is significant contamination from its host galaxy. To isolate the AGN emission-line spectrum, we modeled the continuum by a linear combination of a power law continuum, an FeII complex template, and the seven eigenspectra of starlight. The adopted FeII template was taken from Boroson & Green (1992). The eigenspectra were built from the standard single stellar population spectral library developed by Bruzual & Charlot (2003) through the principal component analysis (PCA) method (e.g., Wang & Wei 2008; Francis et al. 1992). An additional Galactic extinction curve with RV = 3.1 was included in the modeling to account for the intrinsic extinction of the host galaxy. χ2 minimizations were iteratively performed over the rest-frame wavelength range from 3700 to 7000 Å, except for the regions with strong emission lines. The line width of the FeII template and the velocity dispersion of the starlight were predetermined through cross-correlation method before each iteration. The removal of the continuum is illustrated in Fig. 1 as well.
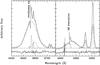 |
Fig. 2 Line profile modelings by a sum of a set of Gaussian components for the Hα (left panel) and Hβ (right panel) regions. The blueshifted Balmer absorptions are marked by the short vertical lines. In each panel, the observed and modeled line profiles are plotted by light and heavy solid lines. Each Gaussian component in emission is shown by a dashed line. The subpanel underneath each line spectrum presents the residuals between the observed and modeled profiles. |
The AGN emission and absorption lines were subsequently modeled on the isolated line spectrum by using the SPECFIT task (Kriss 1994) in the IRAF package. The line modelings are schematically presented in the left and right panels in Fig. 2 for the Hα and Hβ regions. The two narrow Balmer absorptions are marked by the vertical short lines in the figure. Each emission line is modeled by a free Gaussian function, except for the broad Hα emission and the [OIII] doublet. Figure 2 clearly shows that a linear combination of two broad Hα components is required to properly reproduce the observed line profile. We measured the FWMH of the total broad Hα emission with the IRAF/SPLOT task from the residual profile that was obtained by subtracting the modeled narrow emission (i.e., Hα, [NII]λλ6548, 6583) and absorption lines from the the observed profile. In addition to the narrow peak, a broad and blueshifted component is necessary to model the small blue wing of the [OIII]λ5007 profile. The [OIII]λ4959 ([NII]λ6548) line profile was set to be the same as [OIII]λ5007 ([NII]λ6583). The intensity ratio of the [OIII] ([NII]) doublet was fixed to the theoretical value of 3. In total, the freedom in the χ2 minimization is 21 and 15 for the Hα and Hβ regions.
3. Results and discussions
The measured line properties are tabulated in Table 1. The reported flux of the Hα broad emission (and the [OIII]λ5007 line emission) is the sum of the two fitted components. The quoted line width and velocity shift is based on the fitted narrow peak for the [OIII] line. The flux of the FeII blends (FeIIλ4570) was measured in the rest-frame wavelength range from 4434 to 4684 Å, which results in a parameter of RFe of 0.64 ± 0.20. RFe is defined as the flux ratio between the FeIIλ4570 and Hβ broad component. All the reported line widths were not corrected for the intrinsic instrument resolution of σinst ≈ 65 km s-1. Because of the evident contamination of the starlight in the integrated spectrum, we calculated the reported line shifts with respect to the modeled starlight component3: Δυ = Δυline − Δυhost, where Δυline and Δυhost are the modeled velocity shifts with respect to the nominal redshift for a given emission or absorption line and for the host galaxy. A negative value of Δυ corresponds to a blueshift, a positive value to a redshift.
All the uncertainties reported in the table (except for the FWHM of Hαb) only include the errors at 1σ significance level resulting from the χ2 minimizations. The error of the FWHM of Hαb was obtained from a statistics on the multiple measurements by the IRAF/SPLOT task. A proper error propagation was taken into account in the reported uncertainties of Δυ.
3.1. Balmer absorption lines
We argue that the observed blueshifted Balmer absorption lines most likely result from an outflow from the central engine, and not from the host galaxy. The starlight component was properly removed from the observed integral spectrum, as described above. Moreover, the lack of a strong Balmer break enabled us to exclude that the observed Balmer absorptions originate from a post-starburst galaxy with strong Balmer absorptions (e.g., Brotherton et al. 1999; Wang & Wei 2006). In interpreting of the Balmer absorptions in AGNs, the intrinsic equivalent width (EW) depends on whether the absorbing gas covers the BLR or not (e.g., de Kool et al. 2001). The latter scenario is favored in the object from comparing the measured Balmer absorption EW ratio with its theoretical value. In an absorption line without saturation, its EW could be related to its column density N as (Jenkins 1986) 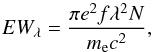 (1)where f is the oscillator strength. A theoretical fλ value of 7.26 is therefore expected for the Hα-to-Hβ ratio, which is very close to the observed EW ratio of EW(Hα) /EW(Hβ) = 7.38 ± 4.32 when both absorption lines are normalized with respect to the modeled AGN continuum. In contrast, the observed ratio is closed to 1 if both absorption lines are normalized to the corresponding broad emission line. This comparison therefore indicates that the absorbing gas responsible for the Balmer transitions is not saturated and fully covers the continuum source.
We furthermore estimated the neutral hydrogen column density from Eq. (1). The inferred column densities of hydrogen at n = 2 shell from the Hα and Hβ absorption lines are NHI,2 = (1.2 ± 0.5) × 1014 cm-2 and (1.6 ± 2.2) × 1014 cm-2. The neutral hydrogen column density was derived from NHI ≈ NHI,1 + NHI,2, where NHI,1 is the column density of hydrogen at n = 1 shell and is estimated by following Hall (2007): 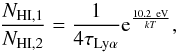 (2)where τLyα is the optical depth at the center of the Lyα absorption. The depth τLyα was inferred from the relationship τLyα = 0.12τHα(NHI,1/NHI,2) (see Eq. (1) in Aoki 2010). Substituting this relationship into Eq. (2) results in a relation
 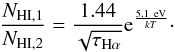 (3)Taking T = 7500 K (Osterbrock & Ferland 2006) and τHα = 1.69 × 10⁵EW(Hα) /λ/b = 8.66 (where b is the Doppler parameter of the absorption line after correcting for the intrinsic instrumental resolution), the inferred neutral hydrogen column density is ~1.5 × 1017 cm-2.
3.2. UV and X-ray observations
SDSS J1126+4252 is particularly weak and hard in UV and X-ray bands. The object is a common source in the second XMM-Newton serendipitous source catalog (XMMSSC) and the XMM-Newton optical Monitor serendipitous UV source survey catalog (XMMOMSUSS). Vagnetti et al. (2010) showed that the inferred specific luminosities at 2500 Å and 2 keV are 4.8 × 1028 erg s-1 Hz-1 and 6.6 × 10²³ erg s-1 Hz-1. Its very hard X-ray spectrum can additionally be derived from the very high hardness ratios4: HR3 = 0.52 and HR4 = 0.63.
Ji et al. (2012, 2013) recently pointed out that a rigorous condition is required for the formation of Balmer absorptions. The absorptions are likely caused by Lyα resonant pumping in a partially ionized region with a high column density of NH ~ 1021−22 cm-2. A heavy obscuration as a result of the required high column density is a possible explanation of the observed extremely weak and hard emission in both UV and X-ray.
3.3. Eddington ratio and SMBH mass
We estimated the SMBH mass MBH in terms of its Hα broad component according to the calibration in Greene & Ho (2007): 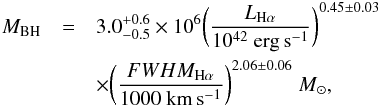 (4)where LHα is the intrinsic luminosity of the Hα broad component corrected for the local extinction. The extinction was inferred from the narrow-line ratio Hα/Hβ, assuming the Balmer decrement for standard case B recombination and a Galactic extinction curve with RV = 3.1. With the estimated MBH, the Eddington ratio L/LEdd (where LEdd = 1.26 × 1038MBH/M⊙ is the Eddington luminosity) was obtained from a combination of the bolometric correction of Lbol = 9λLλ(5100 Å) (Kaspi et al. 2000) and the L5100 Å − LHα relation reported in Greene & Ho (2005),
 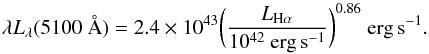 (5)This luminosity relation has an rms scatter of 0.2 dex around the best-fit line. The calculated MBH and L/LEdd are ≈1.8 × 10⁸M⊙ and ≈0.06. By combining the intrinsic scatters of the relationships and the uncertainties derived from our line modelings, a proper error propagation returns 1σ uncertainties of 0.40 dex and 0.45 dex for the calculated MBH and L/LEdd.
We argue that the inferred MBH from the broad Hα emission agrees with the properties of the host galaxy. With the velocity dispersion of the host galaxy of σ⋆ ~ 270 km s-1 obtained from our continuum modeling, the MBH − σ⋆ relation of log (MBH/M⊙) = 8.13 + 4.02log (σ⋆/ 200 km s-1) (Tremaine et al. 2004) yields a blackhole mass of log (MBH/M⊙) ~ 8.7, which is highly consistent with the value estimated from the broad Hα emission.
3.4. Stratified NLR kinematics
The spectral analysis allows us to study the line shifts in SDSS J1126+4252 by using its host starlight component as a reference of the systematic velocity. One can see from Table 2 that all the low-ionized narrow emission lines show a redshift with respect to its host galaxy, while a blueshift is identified in the high-ionized emission line [NeIII]λ3868. It is interesting that the [OIII]λ5007 emission line has a marginal blueshift of Δυ = −10 ± 30 km s-1.
A strong anticorrelation between the velocity shifts and ionization potential (IP) is shown in Fig. 3. The velocity shift of the emitting gas of neutral hydrogen atom is taken from the measurement of narrow Hα emission, both because the narrow Hα and Hβ emission show comparable velocity shifts and because of the higher signal-to-noise ratio of the narrow Hα line. An average value of velocity shift is adopted in the figure for the [SII] doublet. The best fit yields a relation of Δυ = (186.4 ± 35.4) − (4.00 ± 0.80)IP. Komossa et al. (2008) proposed a similar correlation between the line shift and IP in the narrow-line Seyfert 1 galaxies with a high [OIII] line blueshift over 150 km s-1.
Because the AGN NLR gas is believed to be generally stratified in density and ionization potential (e.g., Filippenko & Halpern 1984; Filippenko 1985; De Robertis & Osterbrock 1986), our fitted relationship implies a complicated NLR kinematics in SDSS J1126+4252. A de-accelerated outflow is expected for the inner NLR gas, while an accelerated inflow for the outer NLR gas. The turnover of the radial velocity occurs at the [OIII]λ5007 emission-line gas, whose radial velocity shift with respect to the local system determined from the host starlight is very close to zero. Although the outflows from central AGNs on various scales have frequently been identified in AGNs (e.g., Komossa et al. 2008 and Fabian 2012 for a recent review), the inflows have already been revealed in a few of nearby AGNs through integrated field spectroscopic observations in both optical band and near-infrared (e.g., Fathi et al. 2005; Storchi-Bergmann et al. 2007; Riffel et al. 2008, 2013; Riffel & Storchi-Bergmann 2011). The observations reveal distinct kinematics for different emitting gas. The inflowing gas to the central active nucleus can be traced by the H2 emission, the outflowing gas by the [FeII] emission, which is similar to the kinematics revealed in SDSS J1126+4252.
The implications described above are based on the scenario in which the detected NLR lines are seen in front of the central AGN. We cannot exclude an alternative scenario here in which these NLR lines are seen behind the central source. In this scenario, the obtained relationship implies a de-accelerated inflow for the inner NLR gas, and an accelerated outflow for the outer NLR gas.
Our spectral analysis indicates that in SDSS J1126+4252 all the narrow emission lines, except for the [OIII], show strong velocity shifts with respect to the local system determined from the host starlight. This causes concern that AGN narrow emission lines, even for the low-ionized lines, might not be a reliable substitute for the velocity of the local system. A large sample is needed to perform a more detailed examination of the relationship between the velocity shifts of various narrow emission lines and the local system determined from host starlight in the future.
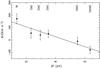 |
Fig. 3 Correlation between velocity shifts and ionization potential (IP). A positive velocity denotes a redshift, a negative value a blueshift. The best-fit line is overplotted by the solid line. |
Spectral properties of SDSS J1126+4252.
4. Conclusions
We performed a detailed spectral analysis on SDSS J11261.63+425246.4, which allowed us to identify the object as a new Balmer-absorption AGN. By using the modeled host starlight as the reference of the local system, a stratified kinematics was identified in the NLR of the object, that is, a strong anticorrelation between the inferred velocity shifts and ionization potentials. The revealed relationship implies a de-accelerated outflow stream for its inner NLR gas, and an accelerated inflow stream for its outer NLR gas.
This object has been analyzed by Hu et al. (2008) in their large type I AGN sample. The Balmer absorptions and starlight component were, however, not taken into account in their spectral modeling.
IRAF is distributed by the National Optical Astronomy Observatory, which is operated by the Association of Universities for Research in Astronomy, Inc., under cooperative agreement with the National Science Foundation.
Hu et al. (2008) used the [OIII]λ5007 line as a reference and found that the [OII] emission line might be a more reliable reference than either [OIII] or Hβ. Our results are consistent with their measurements if the [OIII] line is used as a reference.
The hardness ratios are defined as HR3 = (CR4 − CR3)/(CR4 + CR3) and HR4 = (CR5 − CR4)/(CR5 + CR4), where CR3, CR4, and CR5 are the count rates in the energy bands 1−2, 2−4.5, and 4.5−12 keV, respectively.
Acknowledgments
The authors thank Todd A. Boroson and Richard F. Green for providing the optical FeII template. This research has made use of the SDSS archive data that are created and distributed by the Alfred P. Sloan Foundation. This study is supported by the Chinese National Basic Research Program (973 program, Grant No. 2014CB845800). J.W. is supported by the National Natural Science Foundation of China (grant No. 11473036). D.W.X. is supported by the National Natural Science Foundation of China under grant No. 11273027.
References
- Aoki, K. 2010, PASJ, 62, 1333 [NASA ADS] [Google Scholar]
- Aoki, K., Iwata, I., Ohta, K., et al. 2006, ApJ, 651, 84 [NASA ADS] [CrossRef] [Google Scholar]
- Boroson, T. A., & Green, R. F. 1992, ApJS, 80, 109 [NASA ADS] [CrossRef] [Google Scholar]
- Brotherton, M. S., van Breugel, W., Stanford, S. A., et al. 1999, ApJ, 520, 87 [Google Scholar]
- Bruzual, G., & Charlot, S. 2003, MNRAS, 344, 1000 [NASA ADS] [CrossRef] [Google Scholar]
- Cardelli, J. A., Clayton, G. C., & Mathis, J. S. 1989, ApJ, 345, 245 [NASA ADS] [CrossRef] [Google Scholar]
- Croton, D. J., Springel, V., White, S. D. M., et al. 2006, MNRAS, 365, 11 [NASA ADS] [CrossRef] [Google Scholar]
- de Kool, M., Arav, N., Becker, R. H., et al. 2001, ApJ, 548, 609 [NASA ADS] [CrossRef] [Google Scholar]
- De Robertis, M. M., & Osterbrock, D. E. 1986, ApJ, 301, 727 [NASA ADS] [CrossRef] [Google Scholar]
- Di Matteo, P., Combes, F., Melchior, A.-L., & Semelin, B. 2007, A&A, 468, 61 [NASA ADS] [CrossRef] [EDP Sciences] [Google Scholar]
- Fabian, A. C. 1999, MNRAS, 308, L39 [NASA ADS] [CrossRef] [Google Scholar]
- Fabian, A. C. 2012, ARA&A, 50, 455 [NASA ADS] [CrossRef] [Google Scholar]
- Fathi, K., Storchi-Bergmann, T., Riffel, R. A., et al. 2006, ApJ, 641, L25 [NASA ADS] [CrossRef] [Google Scholar]
- Filippenko, A. V. 1985, ApJ, 289, 475 [NASA ADS] [CrossRef] [Google Scholar]
- Filippenko, A. V., & Halpern, J. P. 1984, ApJ, 285, 458 [NASA ADS] [CrossRef] [Google Scholar]
- Francis, P. J., Hewett, P. C., Foltz, C. B., & Chaffee, F. H. 1992, ApJ, 398, 476 [NASA ADS] [CrossRef] [Google Scholar]
- Granato, G. L., De Zotti, G., Silva, L., Bressan, A., & Danese, L. 2004, ApJ, 600, 580 [Google Scholar]
- Greene, J. E., & Ho, L. C. 2005, ApJ, 630, 122 [NASA ADS] [CrossRef] [Google Scholar]
- Greene, J. E., & Ho, L. C. 2007, ApJ, 670, 92 [NASA ADS] [CrossRef] [Google Scholar]
- Hall, P. B. 2007, AJ, 133, 1271 [NASA ADS] [CrossRef] [Google Scholar]
- Hamann, F., & Sabra, B. 2004, ASPC, 311, 203 [Google Scholar]
- Hirschmann, M., Naab, T., Davé, R., et al. 2013, MNRAS, 436, 2929 [NASA ADS] [CrossRef] [Google Scholar]
- Hu, C., Wang, J. M., Ho, L. C., et al. 2008, ApJ, 687, 78 [NASA ADS] [CrossRef] [Google Scholar]
- Hutchings, J. B., Crenshaw, D. M., Kraemer, S. B., et al. 2002, AJ, 124, 2543 [NASA ADS] [CrossRef] [Google Scholar]
- Jenkins, E. B. 1986, ApJ, 304, 739 [NASA ADS] [CrossRef] [Google Scholar]
- Ji, T., Wang, T.-G., Zhou, H.-Y., & Wang, H.-Y. 2012, RAA, 12, 369 [NASA ADS] [Google Scholar]
- Ji, T., Zhou, H.-Y., Wang, T.-G., & Wang, H.-Y. 2013, ChA&A, 37, 17 [NASA ADS] [Google Scholar]
- Kaspi, S., Smith, P. S., Netzer, H., et al. 2000, ApJ, 533, 631 [NASA ADS] [CrossRef] [Google Scholar]
- Komossa, S., Xu, D., Zhou, H., & Storchi-Bergmann, T. 2008, ApJ, 680, 926 [NASA ADS] [CrossRef] [Google Scholar]
- Kriss, G. 1994, Astronomical Data Analysis Software and systems III, ASP Conf. Ser., 61, 437 [Google Scholar]
- Osterbrock, D. E., & Ferland, G. J. 2006, Astrophysics of Gaseous Nebulae and Active Galactic Nuclei, 2nd edn. (University Science Books) [Google Scholar]
- Pineau, F.-X., Motch, C., Carrera, F., et al. 2011, A&A, 527, 126 [Google Scholar]
- Riffel, R. A., & Storchi-Bergmann, T. 2011, MNRAS, 417, 2752 [NASA ADS] [CrossRef] [Google Scholar]
- Riffel, R. A., Storchi-Bergmann, T., Winge, C., et al. 2008, MNRAS, 385, 1129 [NASA ADS] [CrossRef] [Google Scholar]
- Riffel, R. A., Storchi-Bergmann, T., & Winge, C. 2013, MNRAS, 430, 2249 [NASA ADS] [CrossRef] [Google Scholar]
- Schlegel, D., Finkbeiner, D. P., & Davis, M. 1998, ApJ, 500, 525 [NASA ADS] [CrossRef] [Google Scholar]
- Silk, J., & Rees, M. J. 1998, A&A, 331, L1 [NASA ADS] [Google Scholar]
- Somerville, R. S., Hopkins, P. F., Cox, T. J., Robertson, B. E., & Hernquist, L. 2008, MNRAS, 391, 481 [NASA ADS] [CrossRef] [Google Scholar]
- Storchi-Bergmann, T., Dors, O. L., Jr., Riffel, R. A., et al. 2007, ApJ, 670, 959 [NASA ADS] [CrossRef] [Google Scholar]
- Tremaine, C. A., Heckman, T. M., Kauffmann, G., et al. 2004, ApJ, 613, 898 [NASA ADS] [CrossRef] [Google Scholar]
- Vagnetti, F., Turriziani, S., Trevese, D., & Antonucci, M. 2010, A&A, 519, 7 [Google Scholar]
- Veilleux, S., Cecil, G., & Bland-Hawthorn, J. 2005, ARA&A, 43, 769 [Google Scholar]
- Wang, J., & Wei, J. Y. 2006, ApJ, 648, 158 [NASA ADS] [CrossRef] [Google Scholar]
- Wang, J., & Wei, J. Y. 2008, ApJ, 679, 86 [NASA ADS] [CrossRef] [Google Scholar]
- Wang, T., Dai, H., & Zhou, H. 2008, ApJ, 674, 668 [NASA ADS] [CrossRef] [Google Scholar]
All Tables
All Figures
|
Fig. 1 Illustration of the modeling and removal of the continuum. The continuum-subtracted emission-line spectrum is shown by the top curve. Below the emission-line spectrum, the modeled continuum is overplotted by the red curve on the observed spectrum. The modeled continuum is obtained by a linear combination of a starlight component, a power law continuum from the AGN, and the emission from the FeII complex, which are displayed in ordinals below the observed spectrum. All the spectra are shifted vertically by an arbitrary amount for visibility. |
| In the text | |
|
Fig. 2 Line profile modelings by a sum of a set of Gaussian components for the Hα (left panel) and Hβ (right panel) regions. The blueshifted Balmer absorptions are marked by the short vertical lines. In each panel, the observed and modeled line profiles are plotted by light and heavy solid lines. Each Gaussian component in emission is shown by a dashed line. The subpanel underneath each line spectrum presents the residuals between the observed and modeled profiles. |
| In the text | |
|
Fig. 3 Correlation between velocity shifts and ionization potential (IP). A positive velocity denotes a redshift, a negative value a blueshift. The best-fit line is overplotted by the solid line. |
| In the text | |
Current usage metrics show cumulative count of Article Views (full-text article views including HTML views, PDF and ePub downloads, according to the available data) and Abstracts Views on Vision4Press platform.
Data correspond to usage on the plateform after 2015. The current usage metrics is available 48-96 hours after online publication and is updated daily on week days.
Initial download of the metrics may take a while.