Fig. 1
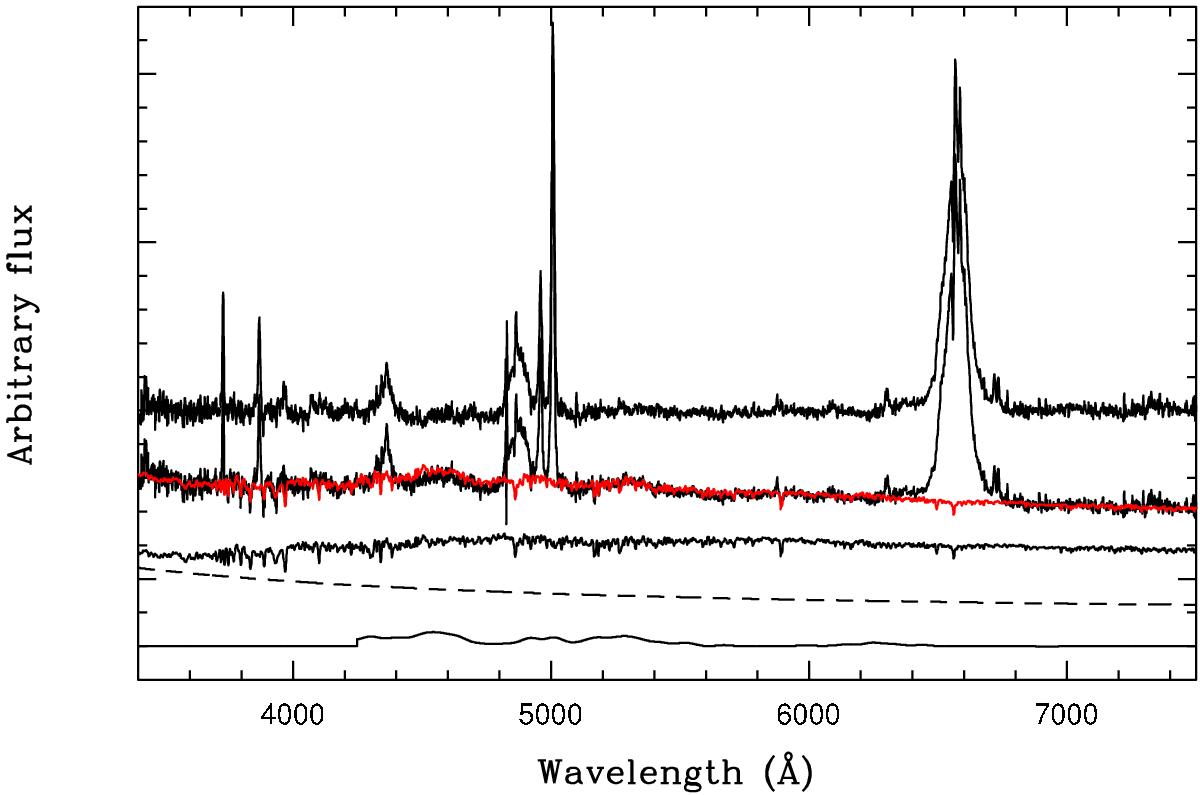
Illustration of the modeling and removal of the continuum. The continuum-subtracted emission-line spectrum is shown by the top curve. Below the emission-line spectrum, the modeled continuum is overplotted by the red curve on the observed spectrum. The modeled continuum is obtained by a linear combination of a starlight component, a power law continuum from the AGN, and the emission from the FeII complex, which are displayed in ordinals below the observed spectrum. All the spectra are shifted vertically by an arbitrary amount for visibility.
Current usage metrics show cumulative count of Article Views (full-text article views including HTML views, PDF and ePub downloads, according to the available data) and Abstracts Views on Vision4Press platform.
Data correspond to usage on the plateform after 2015. The current usage metrics is available 48-96 hours after online publication and is updated daily on week days.
Initial download of the metrics may take a while.