Fig. 2
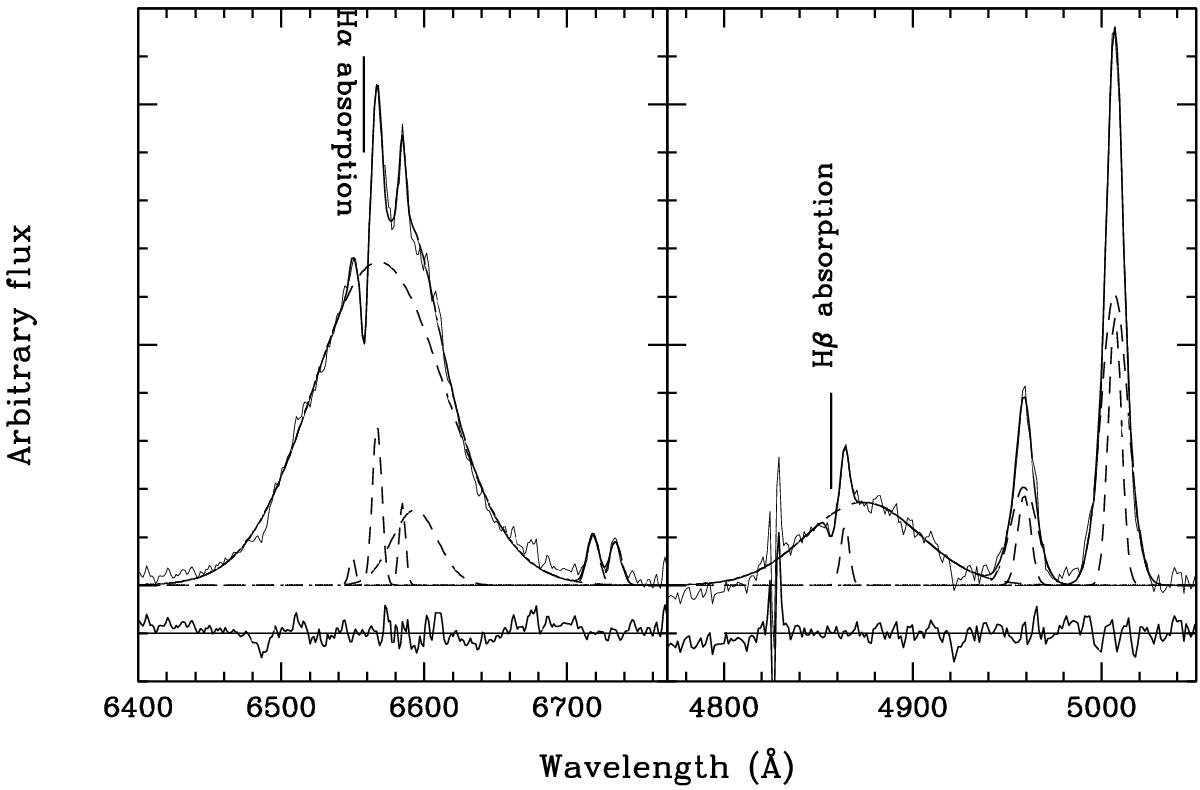
Line profile modelings by a sum of a set of Gaussian components for the Hα (left panel) and Hβ (right panel) regions. The blueshifted Balmer absorptions are marked by the short vertical lines. In each panel, the observed and modeled line profiles are plotted by light and heavy solid lines. Each Gaussian component in emission is shown by a dashed line. The subpanel underneath each line spectrum presents the residuals between the observed and modeled profiles.
Current usage metrics show cumulative count of Article Views (full-text article views including HTML views, PDF and ePub downloads, according to the available data) and Abstracts Views on Vision4Press platform.
Data correspond to usage on the plateform after 2015. The current usage metrics is available 48-96 hours after online publication and is updated daily on week days.
Initial download of the metrics may take a while.