| Issue |
A&A
Volume 573, January 2015
|
|
|---|---|---|
| Article Number | A109 | |
| Number of page(s) | 11 | |
| Section | Interstellar and circumstellar matter | |
| DOI | https://doi.org/10.1051/0004-6361/201424696 | |
| Published online | 06 January 2015 | |
Hot ammonia around young O-type stars
II. JVLA imaging of highly excited metastable NH3 masers in W51-North
1 Joint Institute for VLBI in Europe, Postbox 2, 7990 AA Dwingeloo, The Netherlands
e-mail: This email address is being protected from spambots. You need JavaScript enabled to view it.
2 Max-Planck-Institut für Radioastronomie, Auf dem Hügel 69, 53121 Bonn, Germany
3 Astronomy Department, Abdulaziz University, PO Box 80203, 21589 Jeddah, Saudi Arabia
4 Harvard-Smithsonian Center for Astrophysics, 60 Garden Street, Cambridge, MA 02138, USA
5 Centro de Radioastronomía y Astrofisíca, UNAM, Morelia, CP 58089 Michoacán, México, Mexico
6 US Naval Research Laboratory, Code 7213, Washington, DC 20375, USA
Received: 28 July 2014
Accepted: 1 November 2014
Abstract
Context. This paper is the second in a series of ammonia (NH3) multilevel imaging studies in high-mass star forming regions.
Aims. We want to identify the location of the maser emission from highly excited levels of ammonia within the W51 IRS2 high-mass star forming complex that was previously discovered in a single dish monitoring program.
Methods. We have used the Karl Jansky Very Large Array (JVLA) at the 1 cm band to map five highly excited metastable inversion transitions of NH3, (J,K) = (6,6), (7, 7), (9, 9), (10, 10), and (13, 13), in W51 IRS2 with ~0.̋2 angular resolution.
Results. We present detections of both thermal (extended) ammonia emission in the five inversion lines, with rotational states ranging in energy from about 400 K to 1700 K, and point-like ammonia maser emission in the (6, 6), (7, 7), and (9, 9) lines. For the point-like emission, we estimate lower limits to the peak brightness temperatures of 1.7 × 10⁵ K, 6 × 10³ K, and 1 × 10⁴ K for the (6, 6), (7, 7), and (9, 9) transitions, respectively, confirming their maser nature. The thermal ammonia emits around a local standard of rest velocity of VLSR = 60 km s-1, near the cloud’s systemic velocity, appears elongated in the east-west direction across 4′′ and is confined by the HII regions W51d (to the north), W51d1 (to the east), and W51d2 (to the west). The NH3 masers are observed in the eastern tip of the dense clump traced by thermal NH3, offset by 0.̋65 to the east from its emission peak, and have a peak velocity at ~47.5 km s-1. No maser components are detected near the systemic velocity. The NH3 masers arise close to but separated from (0.̋65 or 3500 AU) the rare vibrationally excited SiO masers, which are excited in a powerful bipolar outflow driven by the deeply embedded high-mass young stellar object (YSO) W51-North. This means that the two maser species cannot be excited by the same object. Interestingly, the NH3 masers originate at the same sky position as a peak in a submm line of SO2 imaged with the Submillimeter Array, tracing a face-on circumstellar disk or ring around W51-North. In addition, the thermal emission from the most highly excited NH3 lines, (10, 10) and (13, 13), shows two main condensations, the dominant one towards W51-North with the SiO and H2O masers, and a weaker peak at the NH3 maser position.
Conclusions. We propose a scenario where the ring seen in SO2 emission is a circumbinary disk surrounding (at least) two high-mass YSOs, W51-North (exciting the SiO masers) and a nearby companion (exciting the NH3 masers), separated by 3500 AU. This finding indicates a physical connection (in a binary) between the two rare SiO and NH3 maser species.
Key words: masers / stars: formation / ISM: molecules / radio lines: ISM / ISM: individual objects: W51 / ISM: clouds
© ESO, 2015
1. Introduction
Intense NH3 masers were first detected in the 1980s in non-metastable transitions from single dish monitoring with the 100 m telescope at Effelsberg (Wilson et al. 1982; Madden et al. 1986; Mauersberger et al. 1987; Wilson & Henkel 1988). Recently, Henkel et al. (2013) reported a total of 19 NH3 maser lines towards the prominent massive star forming complex W51 IRS2, related to highly excited inversion doublets from both metastable and non-metastable levels. In addition to the 19 masers reported by Henkel et al. (2013), two additional maser lines were previously reported in W51-IRS2, raising the total number of NH3 maser lines to 21. Most of these lines have no known counterpart in any other source (see Henkel et al. 2013, their Sect. 3.2, for detailed statistics). Therefore, W51 IRS2 is quite remarkable, providing the cosmic source with by far the largest number of detected masing ammonia lines.
W51 IRS2 is part of W51 (at a distance of 5.4 kpc; Xu et al. 2009; Sato et al. 2010), one of the most luminous massive star forming regions in the Galaxy (with ~106L⊙), containing a cluster of O-type forming stars associated with three main regions: W51 IRS1, W51 Main, and W51 IRS2 itself. While W51 IRS1 is associated with an evolved HII region (size ~1 pc) and is deprived of molecular gas or dust, W51 Main and W51 IRS2 (separated by approximately one arcminute) are sites of active massive star formation (e.g., Zhang & Ho 1997). W51 Main powers strong OH (Etoka et al. 2012) and H2O (Imai et al. 2002) masers near several ultracompact (UC) HII regions, which are associated with widespread NH3 thermal emission (Zhang & Ho 1997). Interestingly, towards W51 IRS2, very strong maser emission is known from various species, for example, hydroxyl (OH), water (H2O), and even silicon monoxide (SiO; e.g., Gaume & Mutel 1987; Imai et al. 2002; Eisner et al. 2002). In fact, W51 IRS2 is one of only three high-mass star forming regions known to exhibit SiO maser emission (Hasegawa et al. 1986; Zapata et al. 2009b), which originates from vibrationally excited levels higher than 1000 K above the ground state and thus requires highly excited gas, possibly heated either by shocks or radiation from a nearby protostar (e.g., Goddi et al. 2009; Matthews et al. 2010). Therefore, W51 IRS2 is special because it powers the rare NH3 masers as well as the rare SiO masers.
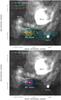 |
Fig. 1 Overlay of the 25 GHz continuum emission (gray scale and white contours) and the 0th moment images of the NH3 (6, 6), (9, 9), (10, 10), and (13, 13) thermal emission lines (cyan, blue, orange, and red contours, respectively) imaged with the JVLA in W51 IRS2. The 25 GHz continuum contours indicate 1 and 3 mJy flux levels per beam, respectively (the peak is ~160 mJy beam-1 and the rms is 0.4 mJy beam-1). The NH3 contours are 20% to 100% with steps of 10% of the line peak for the (6, 6) line (119 mJy beam-1 km s-1) and the (9, 9) line (63 mJy beam-1 km s-1), and 30%, 60%, 90% of the line peak for the (10, 10) (66 mJy beam-1 km s-1) and the (13, 13) lines (65 mJy beam-1 km s-1). The intensity was integrated in the velocity range from 50.3 to 70.7 km s-1 for the (6, 6) line, +50.4 to +66.0 km s-1 for the (9, 9) line, +50.2 to +66.2 km s-1 for the (10, 10) line, and +50.0 to +66.8 km s-1 for the (13, 13) line, respectively. The big white plus marks the position of the (6, 6), (7, 7), and (9, 9) NH3 masers. The small white plus marks the position of the W51-North protostar as inferred from SiO masers (Eisner et al. 2002). We note that the most highly excited lines, the (10, 10) and (13, 13) transitions, show a peak at the NH3 maser position. The images displayed are not corrected for primary beam effects. |
While the Effelsberg monitoring spanning two decades enabled detection and study of the spectral profiles of these ammonia lines, their physical/spatial origin is still unknown. This is particularly relevant in the case of W51 IRS2, since this star forming complex includes several centers of activity, within a few arcseconds (see Fig. 1): a prominent hot core in a pre-HII stage exhibiting very rich chemistry and driving a powerful outflow (W51-North), a UC-HII region exhibiting strong emission from many complex molecules (W51d2), a compact HII region (W51d1), and a cometary HII region (W51d) with little molecular gas associated (e.g., Gaume et al. 1993; Zhang et al. 1998; Zapata et al. 2010). Interferometric mapping is therefore necessary to establish the origin of the NH3 masers within W51 IRS2.
Henkel et al. (2013) identified three families of NH3 maser lines, with emission near 57 km s-1, 54.5 km s-1, and 45 km s-1, respectively. The first two families of maser lines arise from non-metastable levels and have been known for thirty years. The third family was not detected in the observations of Mauersberger et al. (1986, 1987), but now shows maser emission from both metastable and non-metastable lines, well separated from the quasi-thermal emission near 60 km s-1. Henkel et al. (2013) suggested a possible correlation between this third family of highly excited NH3 masers and vibrationally excited SiO masers, since these transitions require particularly high excitation conditions, and both maser species show a velocity component around 45 km s-1 with a secular velocity drift of ~0.2 km s-1 yr-1. Interferometric observations are clearly required to confirm (or refute) a physical relation between these two rare maser species.
Here, we present interferometric observations of five metastable inversion lines from NH3: (J,K) = (6,6), (7,7), (9,9), (10,10), and (13,13). Recent interferometric work has focused on non-metastable lines (e.g., Walsh et al. 2007 and Hoffman & Joyce 2014, and references therein). Interferometric observations of metastable ammonia masers above the (3,3) level are instead rare (one case is the (6,6) maser in NGC 6334 by Beuther et al. 2007). Metastable NH3 masers are particularly interesting because, in contrast to non-metastable masers (or even to other ubiquitous maser species, like H2O), thermal emission from the same transition is also found in the environment of the maser activity. Therefore, these provide the unique chance to investigate maser excitation and its relation with star formation activity.
This paper is the second in a series of NH3 multilevel imaging studies in high-mass star forming regions (for the first, see Goddi et al. 2015, hereafter Paper I). The current paper is structured as follows. The observational setup and data calibration procedures are described in Sect. 2. Spectral profiles and images of different maser transitions are presented in Sect. 3. In Sect. 4, we discuss the relation of the NH3 masers to the star formation activity in W51 IRS2 (Sect. 4.1) and potential pumping mechanisms of these NH3 masers (Sect. 4.2). Finally, we present a summary in Sect. 5.
Parameters of JVLA observations toward W51.
2. Observations
Observations of NH3 towards the W51 complex were conducted using the Karl Jansky Very Large Array (JVLA) of the National Radio Astronomy Observatory (NRAO)1 in the B configuration. By using the broadband JVLA K- and Ka-band receivers, we observed a total of five metastable inversion transitions of NH3: (J,K) = (6,6), (7, 7), (9, 9), (10, 10), and (13, 13) at the 1 cm band, with frequencies going from ≈25.1 GHz for the (6, 6) line to ≈33.2 GHz for the (13, 13) line. Transitions were observed in pairs of independently tunable basebands during 6 h tracks (two targets per track: W51 – this paper; NGC 7538 IRS1 – Paper I) on three different dates in 2012: the (6, 6) and (7, 7) lines on May 31 at K-band, the (9, 9) and (13, 13) lines on June 21, and the (10, 10) transition on August 7, both at Ka-band. Each baseband had eight sub-bands with a 4 MHz bandwidth each (≈40 km s-1 at 30 GHz), providing a total coverage of 32 MHz (≈320 km s-1 at 30 GHz). Each sub-band consisted of 128 channels with a separation of 31.25 kHz (≈0.3 km s-1 at 30 GHz). The typical on-source integration time was about 80 min. Each transition was observed with fast switching, where 80 s scans on-target were alternated with 40 s scans on the nearby (1.2° on the sky) QSO J1924+1540 (measured flux density 0.6–0.7 Jy, depending on frequency). We derived absolute flux calibration from observations of 3C 48 (Sν = 0.5–0.7 Jy, depending on frequency), and bandpass calibration from observations of 3C 84 (Sν = 27–29 Jy, depending on frequency).
The data were edited, calibrated, and imaged in a standard fashion using the Common Astronomy Software Applications (CASA) package. We fitted and subtracted continuum emission from the spectral line data in the uv plane using CASA task UVCONTSUB, combining the continuum (line-free) signal from all eight sub-bands around the NH3 line. Before imaging the NH3 lines, we performed self-calibration on the strong (6, 6) NH3 maser at 47.6 km s-1 (peak flux density ~5 Jy). We then applied the self-calibration solutions from the reference channel to the dataset containing the lines (6, 6) and (7, 7). Since the (9, 9) maser line was much weaker than the (6.6) line (peak flux density ~0.4 Jy), we did not perform self-calibration on the dataset containing the (9, 9) and (13, 13) lines (or for the 10, 10 transition). We discuss the accuracy in both absolute and relative astrometry among different transitions in Sect. 3.3. Using the CASA task CLEAN, we imaged the W51 IRS2 region with a cell size of 0.̋04, covering a 20′′ field around the position  , δ(J2000) = + 14°31′06.̋0. We adopted Briggs weighting with a ROBUST parameter set to 0.5 and smoothed the velocity resolution to 0.4 km s-1, for all transitions. The resulting synthesized clean beam FWHM was 0.̋19–0.̋26 and the typical rms noise level per channel was ≈1.5 mJy beam-1. The observations were conducted pointing the telescopes at W5-IRS1, with a sky position of
  , δ(J2000) = + 14°30′50.̋0 (that way both W51-North and W51-south were included in the JVLA antennas’ primary beam). Therefore, we applied primary beam corrections during cleaning (on the order of 15−25%, depending on transition). Table 1 summarizes the observations.
Parameters of the NH3 maser lines observed toward W51-north.
3. Results
We have mapped five highly excited metastable inversion transitions of NH3(J,K) = (6,6), (7, 7), (9, 9), (10, 10), and (13, 13) in W51 IRS2, with ~0.̋2 angular resolution We detected both thermal (extended) ammonia emission in five inversion lines, with rotational states ranging in energy from about 400 K to 1700 K, and point-like ammonia maser emission in the (6, 6), (7, 7), and (9, 9) lines (Table 2). Using the line-free sub-bands, we also produced images of the radio continuum emission with an rms noise level of 0.4 mJy beam-1, at the frequencies corresponding to the inversion lines (25−33.2 GHz).
In the following we will discuss the spatial and velocity distribution of the molecular gas estimated from the thermal NH3 emission with respect to the ionized gas traced by the continuum emission (Sect. 3.1), spectral profiles of the maser and thermal ammonia lines (Sect. 3.2), and maps of ammonia maser spots (Sect. 3.3).
3.1. Distribution of thermal ionized (continuum) and molecular (NH3) gas
In Fig. 1, we present the integrated thermal emission of the (6, 6), (9, 9), (10, 10), and (13, 13) lines overlaid on the 25 GHz continuum map2; the position of the NH3 masers is indicated by a white plus sign. At 25 GHz, we detected strong free-free continuum emission arising from the HII regions associated with several high-mass young stellar objects (YSOs) forming in the W51 IRS2 cluster. The most prominent ones are the extended cometary HII region W51d and the two compact HII regions W51d1 and W51d2 (see Table 4). This emission has already been mapped at different (centimeter) wavelengths with the VLA at different resolutions (e.g., Gaume et al. 1993). The dense molecular gas traced by the NH3 thermal emission is observed at the southern edge of the W51d HII region, and is elongated along the east-west direction across 4′′. Apparently, it is confined by the ionized gas: W51d1 to the east, W51d2 to the west, and W51d to the north. Among the transitions that we observed, the extended distribution of the thermal emission is best traced by the lower excitation (6, 6) line, which, interestingly, exhibits a clumpy structure along a belt of emission from W51-North to W51-d2. Figure 1 shows that the NH3 masers are enclosed within the lowest contour of the thermal NH3 emission, and are observed in the eastern tip of the dense clump traced by thermal NH3. It is interesting to note that the most highly excited lines, (10, 10) and (13, 13), show the strongest emission around W51-North, but also weaker emission near the NH3 maser position.
In Fig. 2, we also present the position-velocity (pv) diagrams of the (6, 6), (7, 7), (9, 9), (10, 10, and (13, 13) lines. While the (6, 6) line shows the most extended emission (from the maser to d2), the more highly excited lines show strong emission only in the hot core excited by W51-North (e.g., Zapata et al. 2009a). From the pv diagrams, it becomes evident that the NH3 masers are separated in both velocity and position from the peak of thermal NH3 emission tracing the dense gas in W51-North. The thermal NH3 emits in a velocity range from 50 to 71 km s-1 and peaks at around 60 km s-1 (the cloud’s systemic velocity), whereas the three masers peak at 47–50 km s-1 (see Table 2).
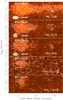 |
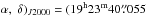
Fig. 2 Position-velocity diagrams of the (J,K) = (6, 6), (7, 7), (9, 9), (10, 10), and (13, 13) lines observed with the JVLA B-array towards W51 IRS2. The cut is taken at the peak of the NH3 core and elongated east-west (i.e., PA = 90°). The zero offset in R.A. corresponds to the phase-center position used in imaging: |
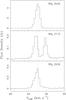 |
Fig. 3 Spectral profiles of the maser emission from the metastable NH3 (6, 6), (7, 7), (9, 9) inversion transition lines observed toward W51-North with the JVLA B-array. The radial velocities are derived with respect to the LSR. The vertical dashed line indicates a velocity of 47.6 km s-1. The velocity resolution is 0.4 km s-1. We note that different flux density scales are adopted for different transitions. We also note that the two ortho transitions, the (6, 6) and (9, 9) lines, show similar profiles, whereas the only para transition, the (7, 7), shows a double-peaked profile (see text). |
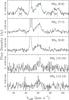 |
Fig. 4 Spectral profiles of the thermal (and maser) emission from the metastable NH3 (6, 6), (7, 7), (9, 9), (10, 10), and (13, 13) inversion transitions, integrated in a region with size of 0.̋8 around the maser position. The spectra shown here are the same as in Fig. 3, but with a narrower flux density and a wider velocity range to highlight the weaker thermal emission. The vertical dashed line indicates a velocity of 60 km s-1. The velocity resolution is 0.4 km s-1. We note that the hyperfine satellite lines (separated by ~ ± 27 − 31 km s-1) are clearly detected for the (6, 6) line (indicated with black vertical lines), but they are also still visible in the (7, 7) spectrum. The upper state energy levels of transitions shown here are ~408−1691 K (see Table 1). |
3.2. Spectral profiles of the NH3 masers and thermal emission
For each transition, we produced spectra by mapping each spectral channel and summing the flux density in each channel map towards the compact maser emission (Figs. 3). The (6, 6) and (9, 9) ortho-transitions show similar central velocities with respect to the local standard of rest (LSR), Vc = 47.6, 47.4 km s-1 (with a scatter smaller than the velocity resolution of 0.4 km s-1), and velocity widths, ΔV1/2 ~ 1.5 km s-1, as determined from single-Gaussian fits (Table 2). The observed line-widths are relatively large for maser emission (>1 km s-1) and the line profiles appear rather asymmetric. Both elements may result from blending of different maser features. The presence of multiple components can be confirmed for the (7, 7) transition, which shows a double-peaked profile, with two narrower components (ΔV1/2 ~ 1 km s-1) at 47.1 and 49.7 km s-1, respectively. The (7, 7) line was the only one out of 19 maser lines observed with Effelsberg to show two velocity components below 50 km s-1 (Henkel et al. 2013), indicating that this is a unique tracer. Based on our JVLA imaging, we can now assess that the two components are separated not only in velocity, but also in space (see Sect. 3.3).
The inversion lines that we imaged with the JVLA are part of a monitoring study with the Effelsberg 100 m telescope (Henkel et al. 2013). Therefore, we can compare our interferometric measurements with single dish observations. The monitoring study revealed a velocity drift of 0.2 km s-1 yr-1 and a significant flux variation in different NH3 maser lines. Therefore, we compare our results with the nearest single dish observations in time. The (6, 6) and (7, 7) lines were observed with the 100 m telescope in April 2012, just two months before our JVLA observations. Henkel et al. (2013) report Vc = 47.2 km s-1, ΔV1/2 ~ 1.5 km s-1, and Fpeak = 5.3 Jy for the (6, 6) line; Vc = 47.3 and 49.9 km s-1, ΔV1/2 ~ 1.4 and 1.2 km s-1, and Fpeak = 0.2 and 0.18 Jy for the two velocity components of the (7, 7) transitions. This is in excellent agreement with our findings (see Table 2). The (9, 9) line was observed with the 100 m telescope in August 2011, one year before our JVLA observations, and had Vc = 46.8 km s-1, ΔV1/2 ~ 1.2 km s-1, and Fpeak = 0.07 Jy. Taking into account the secular velocity drift and allowing for maser emission flux variation, our interferometric measurement of the (9, 9) transition is also consistent with the single dish observations.
It is worth noting that the excellent agreement between the integrated fluxes of the (6, 6) and (7, 7) lines measured with both the single dish and the interferometer, implies that there is no significant extended maser emission that might have been missed by the JVLA. Therefore, we are confident that the maser emission comes from a region smaller than 0.̋2.
The maser nature of the NH3 emission from these highly excited lines has been inferred from the single dish monitoring with Effelsberg, based on emission variability. Our interferometric measurements now allow us to calculate peak brightness temperatures, Tb, based on the equation Tb = S(c/ν)2/ (2kBdΩ), where S is the peak flux density, ν the line frequency and dΩ the solid angle of the source. The compact NH3 emission is not resolved in our JVLA images, therefore we can only give lower limits to the true brightness temperature. Taking a representative beamsize of 0.̋25 as an upper limit to the maser size, given the observed line intensities, we calculated lower limits to the peak brightness temperatures of 1.7 × 10⁵ K, 6 × 10³ K, and 1 × 10⁴ K, for the (6, 6), (7, 7), and (9, 9) transitions, respectively. If the emission were thermal, it would require a local exciting source with a temperature in excess of these values, which we consider extremely unlikely. Therefore, we conclude that our interferometric measurements confirm the maser nature for the emission coming from these highly excited NH3 metastable lines.
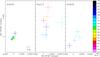 |
Fig. 5 Distribution of NH3 maser emission in W51-North imaged with the JVLA. Emission centroids of the (6, 6), (7, 7), and (9, 9) lines (filled triangles) are shown as a function of velocity in the left, middle, and right panels, respectively. Color denotes line-of-sight. velocity (color scale on the right-hand side). The size of the symbols scales logarithmically with the flux density. The size of the crosses represents the 1σ formal fitting error to the position of the emission in individual velocity channels. The positional offsets are from |
As discussed in Sect. 3.1, in addition to maser emission, in W51 IRS2 we also observe extended thermal emission from NH3. In Fig. 4 we show the spectral profiles of the NH3 thermal emission at the maser position3. As already pointed out, the thermal emission towards the compact maser has a different velocity with respect to the maser, around 60 km s-1, i.e., the cloud’s systemic velocity. Remarkably, we find prominent hyperfine satellite lines in the lowest-excitation (6, 6) line, spaced ~27−31 km s-1 from the main line4 (Fig. 4, top panel). In fact, owing to interaction with the quadrupole moment of the nitrogen nucleus, each NH3 inversion line is split into five components, a main component and four symmetrically spaced satellites with nearly equal intensities (at least in LTE), which make up the quadrupole hyperfine structure (HFS). Since the relative line strengths of the satellite lines are a very small fraction of the main line intensity (<1% for the transitions targeted here), the hyperfine satellites are usually optically thin. The mere presence of measurable hyperfine satellites in the profile of the (6, 6) line, however, indicates very large optical depths even in these highly excited transitions. We estimate an optical depth for the main hyperfine component of the (6, 6) line on the order of 100. Mauersberger et al. (1986, 1987) present a single dish multilevel study of ammonia from both metastable and non-metastable levels in W51 IRS2, and find that most of the targeted transitions are very optically thick (τ> 10), with the (8, 6) doublet showing the largest optical depth of 100, consistent with the value determined here for the (6, 6) doublet.
3.3. Velocity-channel centroid maps of NH3 maser emission
In each velocity channel, the maser emission is unresolved in all transitions. We fitted a 2D ellipsoidal Gaussian model to each unresolved emission component in a 50 × 50 pixel area of each channel map. Figure 5 shows the positions (and associated errors), radial velocities, and intensities of the peak emission in different velocity channels for each inversion line. One striking feature shown in these maps is that the centroids of the maser spot distributions are coincident (within a few mas) for the three NH3 transitions (see Table 3 for their absolute positions). Another striking feature is that, while the distribution of maser spots in the (6, 6) and (9, 9) ortho-transitions is fairly compact (within 1−2 mas), the emission from the para (7, 7) line shows a distribution elongated north-south (across 8 mas), with also a separation in LSR velocities. The blueshifted velocities originate from the south while the redshifted velocities are found in the north. This spatial and velocity distribution may explain the double-peaked spectral profile shown in Fig. 3 (middle panel).
Absolute positions of the maser emission centroids for the three NH3 transitions.
High-mass YSOs in W51 IRS2.
In order to establish the accuracy of the superposition of different maser features from different maser lines shown in Fig. 5, in the following we analyze different contributions to their positional errors.
The relative positional errors of maser features from one specific maser transition are noise limited. In particular, the positional uncertainty is proportional to the synthesized beamsize and is inversely proportional to the signal-to-noise ratio of the channel maps, δθ = 0.5θB/SNR, where θB is the FWHM of the synthesized beam, and SNR is the peak intensity divided by the rms noise in a particular velocity channel. With typical SNR> 100 and θB = 0.̋25, the positional accuracy is estimated to be on the order of a fraction of mas (formal errors in the Gaussian fitting, 1σ = 0.̋0002−0.̋001, are consistent with this expectation). We thus conclude that the distribution of the emission in the three inversion lines, the (6, 6) transition, which is compact within 2 mas, the (7, 7) transition, which extends across 8 mas, and the (9, 9) transition, extending across 4 mas, indicates different spatial structures and is not a consequence of relative positional errors.
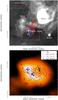 |
Fig. 6 W51 IRS2. Upper panel: overlay of the 25 GHz continuum emission imaged with the JVLA (gray scale and white contours) and the SiO v = 0J = 5–4 0th moment image from the SMA (blue and red contours; Zapata et al. 2009a). The 25 GHz continuum contours indicate 1 and 3 mJy flux levels per beam, respectively (the peak is ~160 mJy beam-1 and the rms is 0.4 mJy beam-1). The SiO 5−4 line contours are from 20% to 90% with steps of 10% of the line peak (5230 Jy beam-1 km s-1 for the red contours and 8744 Jy beam-1 km s-1 for the blue contours). Blue and red contours correspond to blue- and redshifted gas, with integrated velocity ranging from +20 to +58 km s-1 and from +60 to +95 km s-1, respectively. The synthesized beam of the JVLA image is 0.28′′ × 0.24′′, whereas that of the SMA is 0.58′′ × 0.43′′. The dashed white box indicates the zoomed area plotted in the lower panel. Lower panel: overlay of the SO2 [222,20 → 221,21] 0th moment emission imaged with the SMA at 0.̋4 resolution (color image and black contours) with the (10, 10) and (13, 13) thermal NH3 emission (blue and red contours, respectively), as well as several masers observed in W51-North. The integrated velocity range for SO2 is from +50 to +70 km s-1 and the contours are from 30% to 100% with steps of 10% of the line peak (7.8 Jy beam-1 km s-1). The NH3 contours are 30%, 60%, 90% of the line peak for the (10, 10) line (66 mJy beam-1 km s-1) and the (13, 13) line (65 mJy beam-1 km s-1). The black triangles mark the position of the water maser spots observed with the VLA, while the white cross sign marks the centroid position of SiO masers imaged with the VLBA, ( |
When comparing the absolute positions of individual maser lines, two extra sources of uncertainty need to be taken into account. The (6, 6) and (7, 7) lines were observed simultaneously adopting two different basebands, having a ~0.7 GHz separation. The accuracy in their relative separation is limited not only by SNR (and bandpass calibration), but potentially also contains a systematic position shift, which is proportional to the source offset with respect to the phase-tracking center used in correlation, multiplied by the difference in the rest frequencies between the two transitions (for a more detailed discussion see, e.g., Imai et al. 2010; Goddi et al. 2009; and Appendix A in Goddi et al. 2011). Considering that the maser source is located 30′′ northwest from the phase-tracking center (see Sect. 2), and the separation between the (6, 6) and (7, 7) maser lines is ~0.7 GHz, this contribution is potentially a significant fraction of an arcsecond. Methods to remove this potential positional offset are described in Goddi et al. (2009, see their Sect. 2), in the case of SiO maser lines observed with the VLA. In order to test our relative astrometry, we also made images of the (7, 7) masers without applying the self-calibration solutions from the (6, 6) line. While the signal-to-noise ratio of the resulting (7, 7) channel maps was lower than the self-calibrated ones, the relative position between the (6, 6) and (7, 7) maser emission was comparable in the two cases (with and without self-calibration applied), indicating that their relative astrometry is correct within a few mas.
Finally, the precision of the absolute position of interferometric images is limited by phase solutions. The (9, 9) line was observed on a different date and a comparison with the other two lines requires absolute sky coordinates. Our astrometric measurements employ the fast switching phase-referencing technique with a nearby strong calibrator (see Sect. 2). The theoretical error in computing the absolute astrometry is proportional to the separation of the calibrator from the target and the positional accuracy of individual antennas, and inversely proportional to the baseline length. Under good conditions of phase stability, accurate antenna positions (~1 cm), a close calibrator (~1°) with accurately known position (~1 mas), and rapid switching (~1 min), the accuracy is on the order of 1−2% of the synthesized beam. We estimate therefore an accuracy of 2−4 mas for the absolute astrometry. The centroid emissions of the (6, 6) and (9, 9) lines consistently coincide within about 1–2 mas.
Since the (6, 6) and (9, 9) lines show similar positions and the same velocity profile and linewidth, we suggest that the two ortho transitions are coincident in position and velocity. On the other hand, the different spatial (and velocity) distribution of the (7, 7) line cannot be a consequence of phase-errors, as argued above, therefore we conclude that the ortho- and para-NH3 masers show a different structure and velocity.
4. Discussion
For the first time, we imaged high-excitation maser lines from metastable levels of ammonia up to 850 K above the ground in a high-mass star forming region. Because it is an entirely new tracer, there are still many open questions on the nature of these maser lines, but they can potentially open up new frontiers in high-mass star formation studies. In particular, there are several important questions to address: Are the NH3 masers excited in a particular stage of high-mass star formation? Are they associated with outflows, circumstellar accreting gas, or quiescent cores? Why does the bulk of NH3 gas radiate thermal emission and maser emission only at a specific location? Why do thermal and maser emissions peak at different velocities? Is there a connection between rare NH3 and SiO masers? What is the pumping mechanism of these high-excitation maser lines from NH3?
In the following, we will try to address some of these questions.
4.1. Connections of the NH3 masers with star formation activity in W51 IRS2
Our interferometric measurements have enabled us to locate precisely the highly excited NH3 emission (both maser and thermal) in the surroundings of W51-North. This source is a highly obscured YSO, with no mid-IR counterpart (e.g., Okamoto et al. 2001) or free-free emission from a UC-HII region (e.g., Gaume et al. 1993; Eisner et al. 2002), but it exhibits strong thermal dust emission at millimeter and submillimeter wavelengths (e.g., Zapata et al. 2008, 2009a) as well as molecular emission typical of a hot core at an excitation temperature of 100−300 K (e.g., Mauersberger et al. 1987; Zhang et al. 1998; Zapata et al. 2010). In addition, this YSO powers strong H2O, OH, and (exceptionally) SiO masers, all located in the center of this molecular and dusty structure (e.g., Imai et al. 2002; Eisner et al. 2002).
In a series of papers, Zapata and collaborators revealed that the obscured high-mass protostar located in W51-North is associated with a dusty circumstellar disk, a hot gas molecular ring, and a collimated outflow. The simultaneous presence of these elements makes W51-North a compelling target for high-mass star formation studies.
In order to characterize the environment of the NH3 maser in greater detail and establish its relation with W51-North and the surrounding region, we can compare its position with respect to other dense gas and outflow tracers as well as different maser species. Figure 6 shows two overlays: the 25 GHz continuum emission (the same as shown in Fig. 1) with contours of the SiO v = 0, J = 5 − 4 line emission from Zapata et al. (2009a; upper panel), and the image of the SO2222,20 − 221,21 line from Zapata et al. (2009a) with contours of the (10, 10) and (13, 13) thermal NH3 emission (lower panel). In these overlays, we also report positions of known maser species. Figure 7 shows an overlay of the integrated NH3 emission from the (3, 3) doublet with the positions of the known NH3 masers in W51 IRS2 measured with interferometers.
The SiO 5−4 emission, imaged with the Submillimeter Array (SMA) at 0.̋4 resolution, shows the presence of a collimated bipolar outflow, elongated northwest-southeast (PA ~ 150°) over 4′′ or 22 000 AU and centered on W51-North (indicated by a small plus sign in the upper panel of Fig. 6). The redshifted emission of the outflow (from +60 to +95 km s-1) is located toward the northwest, while the blueshifted emission (from +20 to +58 km s-1) points toward the southeast. A similar spatial and velocity structure is probed by the 3D gas kinematics of 22 GHz water masers (Imai et al. 2002) and SiO masers (Eisner et al. 2002), which trace the base of the SiO 5−4 bipolar outflow, at radii between 20 and 2000 AU. In particular, proper motion measurements of the H2O masers (which generally trace shocked gas in massive protostellar outflows; Goddi et al. 2005) revealed the presence of a compact (~5000 AU) and fast (~100 km s-1) outflow (Imai et al. 2002). In addition, VLBI imaging of the SiO v = 2 J = 1 − 0 line indicates that SiO masers may be tracing the innermost and densest portions of this molecular outflow on scales as small as 50 AU (Eisner et al. 2002). The SiO distribution was interpreted in terms of an accelerating outflow from a deeply embedded high-mass YSO, with a 3D acceleration of 0.5 km s-1 yr-1 (or 0.2 km s-1 yr-1 projected along the line-of-sight).
Based on the Effelsberg monitoring of several NH3 maser lines, Henkel et al. (2013) measured a velocity drift on the order of 0.2 km s-1 yr-1, for the 47 km s-1 NH3 masers. Based on the remarkable agreement between both the velocity components and the velocity drifts of SiO and NH3 masers, they proposed a physical relation between the two rare maser species. Our interferometric measurements imply that the two maser species cannot be excited by the same YSO hosted by W51-North. In fact, in Fig. 6 we have marked the positions of the water maser spots as well as the position of the SiO maser source reported by Eisner et al. (2002) and we find that the NH3 maser emission is offset by 0.̋65 from the SiO masers and the centroid of the H2O masers. We explicitly note that this offset is significantly larger than the positional accuracy or registration error between VLA measurements at 7 mm and 1 cm, ≪0.̋1 (Eisner et al. 2002; this work). Therefore, the NH3 masers are not excited in the powerful molecular outflow probed at very small scales by SiO and H2O masers and at large scales in thermal SiO (5−4) emission.
What is then exciting these high-JK NH3 masers? Besides one single water maser spot (shown in the lower panel of Fig. 6), there are no other known maser species spatially coincident with these NH3 masers. In fact, the previously known NH3 (3, 3) masers are excited west of W51d2 (offset by ~9′′; see Fig. 7), emit at VLSR = 54 km s-1, and show spatially extended emission (Zhang & Ho 1995). Wilson et al. (1991) imaged the (9, 8) NH3 maser at VLSR = 55.4 km s-1 with 0.̋2 resolution using the VLA and located its emission towards W51d2 (Fig. 7). CH3OH masers, a typical signpost of high-mass star formation, are excited towards W51d2 but not in W51-North (Surcis et al. 2012). In spite of the lack of other maser species, there is strong thermal emission from high-density gas tracers at the position of the NH3 masers.
The lower panel of Fig. 6 shows the SO2222,20 − 221,21 line emission, imaged with the SMA at 0.̋4 resolution. Remarkably, the overlay reveals that the NH3 maser corresponds to the strongest peak of SO2. In Fig. 6, we also overlay the velocity-integrated (thermal) emission of the (10, 10) and (13, 13) NH3 lines, which supposedly pick out the hottest thermal gas. Interestingly, this highly excited thermal emission shows two main condensations, the dominant one towards W51-North with the SiO and H2O masers, and a second peak at the NH3 maser position. It is worth noting that the peak emission of the 47−50 km s-1 NH3 masers is also the peak position of other high excitation lines, like HCOCH2OH (6213,49–6212,50) with El = 1476 K and HC3N (38−37) (νt = 0) with El = 306 K (Zapata et al. 2010). Zapata et al. (2009a) proposed that the SO2 emission traces a large and flattened molecular ring (with an inner cavity of about 3000 AU and size of about 9000 AU), seen nearly face-on, surrounding the dusty disk5.
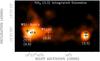 |
Fig. 7 Overlay of the integrated flux of the NH3 (J,K) = (3, 3) line (color image) with the positions of known NH3 masers measured with interferometry (black plus signs) in the W51 IRS2 region. The NH3 (3, 3) map was made with the VLA-C configuration at 1.̋2 resolution (Zhang & Ho 1995). The color scales are linear from 0 to 700 mJy beam-1 km s-1. Positions of the NH3 masers from doublets (J,K) = (3, 3) (Zhang & Ho 1995), (9, 8) (Wilson et al. 1991), (6, 6), (7, 7), (9, 9) (this study), are indicated in the map. The numbers next to the plus signs indicate the maser peak velocities in km s-1. |
Zapata et al. (2010) speculated on the possibility that W51-North may be a binary system. The potential warm companion of W51-North would be located at the SO2 peak to the northeast of the disk/ring. Without clear evidence of outflowing gas activity associated with this potential companion (from SiO 5−4 or CO 3−2), the molecular peak could still be, in principle, the result of the interaction of the outflow from W51-North with a high density portion of the molecular clump, as opposed to being a distinct YSO. Zapata et al. (2010) however noticed that the blueshifted lobe of the CO (J = 3 − 2) outflow has a different position angle with respect to the redshifted lobe (see their Fig. 1), possibly indicating the presence of multiple outflows or at least of a second outflow. In fact, the presence of a binary system (although more compact) at the center of W51-North has also been suggested by the precession of the outflow at very small scales as traced by H2O and SiO masers (Eisner et al. 2002). Our measurements indicate that the size of the cavity observed in SO2 corresponds to the distance between the SiO and NH3 masers. If the molecular ring traces a circumbinary disk seen face-on, then the two maser species would pinpoint the positions of two high-mass YSOs accreting and rotating in the same circumbinary disk: the SiO masers would pinpoint the main member, W51-North, which is driving the powerful outflow, and the NH3 masers would locate the companion. The latter could be a consequence of disk fragmentation due to gravitational instabilities expected in a large, massive disk (e.g., Kratter & Matzner 2006). We conclude that, although the two rare NH3 and SiO masers are not excited in the same YSO, they may have a close physical association in a binary. This physical connection may also explain why both maser species show a velocity component around 47 km s-1 and a secular velocity drift of ~0.2 km s-1 yr-1. We note that the binary scenario is plausible based on the morphology of dense gas and the positions/velocities of individual maser species, but is inconsistent with the velocity field of the thermal emission (neither the SO2 nor the NH3 lines show a component at 47 km s-1).
Is there any direct indication of an outflow from the companion? The double-peaked profile coupled with the north-south elongation of the NH3 (7, 7) maser region could in principle trace a small protostellar disk or a slow outflow. In a circumstellar disk observed nearly edge-on, the gain paths of the redshifted receding and the blueshifted approaching components of the disk are long enough to significantly amplify the background emission at the corresponding velocities. In fact, double-peaked maser profiles based on single dish spectra have been sometimes interpreted in the framework of rotation in Keplerian disks in the past (see, e.g., Cesaroni 1990, in the case of S255-IR). In specific cases, however, VLBI imaging revealed that these double-peaked profiles were not due to rotation but to outflow (see, e.g., Goddi et al. 2007, again in the case of S255-IR). In the case of W51-North a disk is more improbable because the velocity distribution of individual maser spots is not symmetric with respect to the LSR velocity of the source, i.e., 47.5 km s-1 (assuming this corresponds to the central velocity of the (6, 6) or (9, 9) lines). We prefer the outflow interpretation, based on two additional arguments. First, the (7, 7) emission is elongated perpendicular to the east-west (circumbinary) disk observed in SO2. Second, the more redshifted features are located in the north (and the more blueshifted in the south), which is consistent with the geometry and velocity of the SiO 5−4 outflow driven by W51-North. If the NH3 masers are truly tracing a binary member accreting in the same circumbinary disk along with W51-North, then in principle the two outflows could share a similar orientation and the large-scale outflow (traced by thermal SiO and CO emission) could receive contributions from both YSOs. Nevertheless, to discriminate between the different possibilities (disk, outflow, or even multiple distinct gas components), higher spatial resolution observations of the NH3 (7, 7) line with VLBI will be required to resolve and image the ammonia maser emission. The fact that we do not see such a double-peaked profile in the NH3 (6, 6) or (9, 9) lines may be explained by different physical/kinematic structures traced by ortho- and para-NH3 (the two behave like different molecular species; Cheung et al. 1969).
It remains to understand the velocity offset between the maser (~47 km s-1) and thermal emission (centered at 60 km s-1). A similar behavior has been seen in NGC 6334I, where the (6, 6) maser line is offset by 13 km s-1 from the thermal emission at the same position (Beuther et al. 2007). Based on the elongated morphology, Beuther et al. (2007) proposed that the (6, 6) NH3 maser may be associated with some outflow-shock processes, similar to what we propose here for the (7, 7) NH3 masers in W51-North.
4.2. Constraints on the pumping mechanism of the NH3 masers
What is exciting these NH3 maser lines? The pumping mechanisms for most ammonia masers are still unclear. Henkel et al. (2013) describes three main pumping schemes for creating a population inversion of the ammonia upper levels: (1) collisions; (2) overlap with specific molecular lines; and (3) infrared continuum radiation from dust.
Metastable transitions of ortho-ammonia, like (3, 3), are known to be collisionally excited (Walmsley & Ungerechts 1983). Since the K = 0 rotational states are not split into inversion levels because of nuclear spin statistics, and since collisional transitions involving parity changes between K = 0 and K = 3 levels are more favorable, the upper level of the (3, 3) doublet connected with the (0, 0) state can be overpopulated with respect to the lower level of the (3, 3) doublet. Although more complicated, similar arguments could justify a maser in higher excitation lines like the (6, 6) or the (9, 9). In this scheme, however, masers in para-ammonia lines such as the (7, 7) line would be hard to explain. Another complication is that collision rates are only known for inversion levels J ≤ 6 (e.g., Danby et al. 1988), and extrapolation to higher J is a large source of uncertainty. Finally, most of the masers observed by Henkel et al. (2013) are non-metastable, and extremely high densities (1010 − 1012 cm-3) would be required if they were collisionally excited. Therefore the extreme density requirements argue against their collisional excitation. If the non-metastable masers detected by Henkel et al. (2013) were physically associated with the metastable masers imaged here, we consider it unlikely that collisional excitation is at work here.
A fortuitous overlap of a far-infrared line, which allows a population transfer, for example, from a (J,K) inversion level to (J + 1,K), is another possibility. Since from the single dish study, there appear to be 21 distinct maser transitions, it is unlikely that all of these lines are due to several chance alignments of molecular transitions allowing inversion population in these metastable and non-metastable states. In addition, based on morphological arguments, it may be the case that there is a difference between masers in ortho- and para-NH3 (see Sect. 3.3), indicating that the NH3 maser excitation may not result from an overlap with lines from other molecules. Therefore, an alternative mechanism to collisions and line overlap is required.
We believe that the pumping mechanism for ammonia masers in W51-North must be via infrared photons. Madden et al. (1986) was the first to suggest a strong infrared radiation field, such as found around a deeply embedded high-mass YSO, as a pumping mechanism for non-metastable transitions. The kinetic temperature of the bulk of the ammonia emitting gas in W51 IRS2 is ~300 K, as derived by single dish observations (Mauersberger et al. 1987), which is comparable to the kinetic temperature of the molecular ring, 250 K, measured with interferometers by Zapata et al. (2010) in W51-North. This high temperature (at densities where dust and gas temperatures are likely coupled) facilitates vibrational excitation by infrared photons near 10 μm, which correspond to the intensity peak of a black body at Tkin~ 300 K. Therefore, we believe there is a relation of the observed masers to the ammonia vibrational levels. Vibrational excitation may cause significant deviations from quasi-thermal conditions in the ground state. Based on the rapid time variability (Henkel et al. 2013), the masers must have an exponential gain; for example, they may be amplified by a continuum background. In this respect, W51-North, showing a combination of hot dust and molecular gas, may be the ideal location for ammonia masers.
Schilke (1989) built an LVG code, where he extrapolated the NH3 collision rates to high-J (>6) levels and also included vibrational excitation by radiation (the v2 = 1 level). The code predicts the formation of a large number of maser lines at Tkin> 240 K, a temperature at which a sufficient number of 10 μm photons is indeed produced. The problem however is that predictions from current models are highly speculative. For example, Brown & Cragg (1991) built a model that did not have well mixed gas and dust, but had only external dust adjacent to gas, which is clearly not realistic. In addition, the silicate dust feature around 10 μm may considerably alter the radiation field. As modeling work in progress, we plan to modify the IR spectrum testing different shapes of the silicate feature, which may affect the vibrational ground state ammonia spectrum.
5. Summary
We have mapped the NH3 emission from the (6, 6), (7, 7), (9, 9), (10, 10), and (13, 13) inversion transitions in W51-North with 0.̋2 resolution. The main findings of this paper are listed below:
-
We detected both extended thermal ammonia emission in five inversion lines, with rotational states ranging in energy from about 400 K to 1700 K, and point-like ammonia maser emission in the (6, 6), (7, 7), and (9, 9) transitions.
We established a spatial and velocity correlation of three metastable maser transitions of ammonia, demonstrating that, although the two ortho and the one para lines are associated with the same object, they arise from slightly different volumes of gas.
The NH3 (7, 7) emission is not single-peaked but it shows a double-horn profile, and it is extended across 40 AU along north-south. With the current data we cannot differentiate whether this double-horn line profile may be the signature of an underlying accretion disk or associated with a bipolar outflow, although the latter hypothesis is more likely based on the velocity distribution of maser spots. Higher spatial resolution observations of the NH3 (7, 7) line with VLBI are required to address this question.
We established that the NH3 maser is separated (by 0.̋65) from the emission centroids of H2O and SiO masers, the latter tracing a high velocity bipolar outflow emanating from W51-North. This excludes that the NH3 masers are directly excited by W51-North.
Our NH3 maser maps favor the presence of a multiple protostellar system, or at least of a binary, in W51-North: the dominant YSO associated with SiO and H2O masers and a companion pinpointed by the NH3 maser. This finding, along with the fact that both maser species show a velocity component around 47 km s-1 and a secular velocity drift of ~0.2 km s-1 yr-1, suggests that the two rare NH3 and SiO masers may have a close physical association in a binary.
We believe that the pumping mechanism for ammonia masers in W51-North must be via infrared photons.
NRAO is a facility of the National Science Foundation operated under cooperative agreement by Associated Universities, Inc.
The distribution of the (7, 7) line emission is similar to that of the (6, 6) line, but the signal-to-noise ratios are lower, therefore we do not show it.
The spectra displayed in Fig. 4 are integrated in a region with size of 0.̋8 around the maser position; therefore, they do not represent the total thermal emission, which extends across a few arcseconds.
Hyperfine satellite emission is also visible for the (7, 7) doublet, but we refrain from estimating an optical depth, owing to low SNR.
This cavity is observed in other submm lines with moderate excitation above the ground state, like SO (89−78), SO2191,19 − 180,18, HC3N (38−37), and C2H5OH (378,29 − 369,28).
Acknowledgments
We thank Dr. J. Eisner for providing the positions and velocities of water maser spots detected in W51-North with the VLA. We thank the anonymous referee for a constructive report. We are grateful to Malcolm Walmsley for carefully reading the manuscript and for providing useful suggestions.
References
- Beuther, H., Walsh, A. J., Thorwirth, S., et al. 2007, A&A, 466, 989 [NASA ADS] [CrossRef] [EDP Sciences] [Google Scholar]
- Brown, R. D., & Cragg, D. M. 1991, ApJ, 378, 445 [NASA ADS] [CrossRef] [Google Scholar]
- Cesaroni, R. 1990, A&A, 233, 513 [NASA ADS] [Google Scholar]
- Cheung, A. C., Rank, D. M., Townes, C. H., Knowles, S. H., & Sullivan, III, W. T. 1969, ApJ, 157, L13 [NASA ADS] [CrossRef] [Google Scholar]
- Danby, G., Flower, D. R., Valiron, P., Schilke, P., & Walmsley, C. M. 1988, MNRAS, 235, 229 [NASA ADS] [CrossRef] [Google Scholar]
- Eisner, J. A., Greenhill, L. J., Herrnstein, J. R., Moran, J. M., & Menten, K. M. 2002, ApJ, 569, 334 [NASA ADS] [CrossRef] [Google Scholar]
- Etoka, S., Gray, M. D., & Fuller, G. A. 2012, MNRAS, 423, 647 [NASA ADS] [CrossRef] [Google Scholar]
- Gaume, R. A., & Mutel, R. L. 1987, ApJS, 65, 193 [NASA ADS] [CrossRef] [Google Scholar]
- Gaume, R. A., Johnston, K. J., & Wilson, T. L. 1993, ApJ, 417, 645 [NASA ADS] [CrossRef] [Google Scholar]
- Goddi, C., Moscadelli, L., Alef, W., et al. 2005, A&A, 432, 161 [NASA ADS] [CrossRef] [EDP Sciences] [Google Scholar]
- Goddi, C., Moscadelli, L., Sanna, A., et al. 2007, A&A, 461, 1027 [NASA ADS] [CrossRef] [EDP Sciences] [Google Scholar]
- Goddi, C., Greenhill, L. J., Chandler, C. J., et al. 2009, ApJ, 698, 1165 [NASA ADS] [CrossRef] [Google Scholar]
- Goddi, C., Greenhill, L. J., Humphreys, E. M. L., Chandler, C. J., & Matthews, L. D. 2011, ApJ, 739, L13 [NASA ADS] [CrossRef] [Google Scholar]
- Goddi, C., Zhang, Q., & Moscadelli, L. 2015, A&A, 573, A108 (Paper I) [NASA ADS] [CrossRef] [EDP Sciences] [Google Scholar]
- Hasegawa, T., Morita, K., Okumura, S., et al. 1986, in Masers, Molecules, and Mass Outflows in Star Formation Regions, Proc. of a metting held by the Haystack Observatory Wetsford, Mass, eds. A. D. Haschick, & J. M. Moran, 275 [Google Scholar]
- Henkel, C., Wilson, T. L., Asiri, H., & Mauersberger, R. 2013, A&A, 549, A90 [NASA ADS] [CrossRef] [EDP Sciences] [Google Scholar]
- Hoffman, I. M., & Joyce, S. A. 2014, ApJ, 782, 83 [NASA ADS] [CrossRef] [Google Scholar]
- Imai, H., Watanabe, T., Omodaka, T., et al. 2002, PASJ, 54, 741 [NASA ADS] [Google Scholar]
- Imai, H., Nakashima, J.-I., Deguchi, S., et al. 2010, PASJ, 62, 431 [NASA ADS] [Google Scholar]
- Kratter, K. M., & Matzner, C. D. 2006, MNRAS, 373, 1563 [NASA ADS] [CrossRef] [Google Scholar]
- Madden, S. C., Irvine, W. M., Matthews, H. E., Brown, R. D., & Godfrey, P. D. 1986, ApJ, 300, L79 [NASA ADS] [CrossRef] [Google Scholar]
- Matthews, L. D., Greenhill, L. J., Goddi, C., et al. 2010, ApJ, 708, 80 [NASA ADS] [CrossRef] [Google Scholar]
- Mauersberger, R., Henkel, C., Wilson, T. L., & Walmsley, C. M. 1986, A&A, 162, 199 [NASA ADS] [Google Scholar]
- Mauersberger, R., Henkel, C., & Wilson, T. L. 1987, A&A, 173, 352 [NASA ADS] [Google Scholar]
- Okamoto, Y. K., Kataza, H., Yamashita, T., Miyata, T., & Onaka, T. 2001, ApJ, 553, 254 [NASA ADS] [CrossRef] [Google Scholar]
- Sato, M., Reid, M. J., Brunthaler, A., & Menten, K. M. 2010, ApJ, 720, 1055 [NASA ADS] [CrossRef] [Google Scholar]
- Schilke, P. 1989, Diploma Thesis, Univ.of Bonn/Germany [Google Scholar]
- Surcis, G., Vlemmings, W. H. T., van Langevelde, H. J., & Hutawarakorn Kramer, B. 2012, A&A, 541, A47 [NASA ADS] [CrossRef] [EDP Sciences] [Google Scholar]
- Walmsley, C. M., & Ungerechts, H. 1983, A&A, 122, 164 [NASA ADS] [Google Scholar]
- Walsh, A. J., Longmore, S. N., Thorwirth, S., Urquhart, J. S., & Purcell, C. R. 2007, MNRAS, 382, L35 [NASA ADS] [Google Scholar]
- Wilson, T. L., & Henkel, C. 1988, A&A, 206, L26 [NASA ADS] [Google Scholar]
- Wilson, T. L., Batria, W., & Pauls, T. A. 1982, A&A, 110, L20 [NASA ADS] [Google Scholar]
- Wilson, T. L., Gaume, R., & Johnston, K. J. 1991, A&A, 251, L7 [NASA ADS] [Google Scholar]
- Xu, Y., Reid, M. J., Menten, K. M., et al. 2009, ApJ, 693, 413 [NASA ADS] [CrossRef] [Google Scholar]
- Zapata, L. A., Palau, A., Ho, P. T. P., et al. 2008, A&A, 479, L25 [NASA ADS] [CrossRef] [EDP Sciences] [Google Scholar]
- Zapata, L. A., Ho, P. T. P., Schilke, P., et al. 2009a, ApJ, 698, 1422 [NASA ADS] [CrossRef] [Google Scholar]
- Zapata, L. A., Menten, K., Reid, M., & Beuther, H. 2009b, ApJ, 691, 332 [NASA ADS] [CrossRef] [Google Scholar]
- Zapata, L. A., Tang, Y.-W., & Leurini, S. 2010, ApJ, 725, 1091 [NASA ADS] [CrossRef] [Google Scholar]
- Zhang, Q., & Ho, P. T. P. 1995, ApJ, 450, L63 [NASA ADS] [CrossRef] [Google Scholar]
- Zhang, Q., & Ho, P. T. P. 1997, ApJ, 488, 241 [NASA ADS] [CrossRef] [Google Scholar]
- Zhang, Q., Ho, P. T. P., & Ohashi, N. 1998, ApJ, 494, 636 [NASA ADS] [CrossRef] [Google Scholar]
All Tables
Absolute positions of the maser emission centroids for the three NH3 transitions.
All Figures
|
Fig. 1 Overlay of the 25 GHz continuum emission (gray scale and white contours) and the 0th moment images of the NH3 (6, 6), (9, 9), (10, 10), and (13, 13) thermal emission lines (cyan, blue, orange, and red contours, respectively) imaged with the JVLA in W51 IRS2. The 25 GHz continuum contours indicate 1 and 3 mJy flux levels per beam, respectively (the peak is ~160 mJy beam-1 and the rms is 0.4 mJy beam-1). The NH3 contours are 20% to 100% with steps of 10% of the line peak for the (6, 6) line (119 mJy beam-1 km s-1) and the (9, 9) line (63 mJy beam-1 km s-1), and 30%, 60%, 90% of the line peak for the (10, 10) (66 mJy beam-1 km s-1) and the (13, 13) lines (65 mJy beam-1 km s-1). The intensity was integrated in the velocity range from 50.3 to 70.7 km s-1 for the (6, 6) line, +50.4 to +66.0 km s-1 for the (9, 9) line, +50.2 to +66.2 km s-1 for the (10, 10) line, and +50.0 to +66.8 km s-1 for the (13, 13) line, respectively. The big white plus marks the position of the (6, 6), (7, 7), and (9, 9) NH3 masers. The small white plus marks the position of the W51-North protostar as inferred from SiO masers (Eisner et al. 2002). We note that the most highly excited lines, the (10, 10) and (13, 13) transitions, show a peak at the NH3 maser position. The images displayed are not corrected for primary beam effects. |
| In the text | |
|
Fig. 2 Position-velocity diagrams of the (J,K) = (6, 6), (7, 7), (9, 9), (10, 10), and (13, 13) lines observed with the JVLA B-array towards W51 IRS2. The cut is taken at the peak of the NH3 core and elongated east-west (i.e., PA = 90°). The zero offset in R.A. corresponds to the phase-center position used in imaging: |
| In the text | |
|
Fig. 3 Spectral profiles of the maser emission from the metastable NH3 (6, 6), (7, 7), (9, 9) inversion transition lines observed toward W51-North with the JVLA B-array. The radial velocities are derived with respect to the LSR. The vertical dashed line indicates a velocity of 47.6 km s-1. The velocity resolution is 0.4 km s-1. We note that different flux density scales are adopted for different transitions. We also note that the two ortho transitions, the (6, 6) and (9, 9) lines, show similar profiles, whereas the only para transition, the (7, 7), shows a double-peaked profile (see text). |
| In the text | |
|
Fig. 4 Spectral profiles of the thermal (and maser) emission from the metastable NH3 (6, 6), (7, 7), (9, 9), (10, 10), and (13, 13) inversion transitions, integrated in a region with size of 0.̋8 around the maser position. The spectra shown here are the same as in Fig. 3, but with a narrower flux density and a wider velocity range to highlight the weaker thermal emission. The vertical dashed line indicates a velocity of 60 km s-1. The velocity resolution is 0.4 km s-1. We note that the hyperfine satellite lines (separated by ~ ± 27 − 31 km s-1) are clearly detected for the (6, 6) line (indicated with black vertical lines), but they are also still visible in the (7, 7) spectrum. The upper state energy levels of transitions shown here are ~408−1691 K (see Table 1). |
| In the text | |
|
Fig. 5 Distribution of NH3 maser emission in W51-North imaged with the JVLA. Emission centroids of the (6, 6), (7, 7), and (9, 9) lines (filled triangles) are shown as a function of velocity in the left, middle, and right panels, respectively. Color denotes line-of-sight. velocity (color scale on the right-hand side). The size of the symbols scales logarithmically with the flux density. The size of the crosses represents the 1σ formal fitting error to the position of the emission in individual velocity channels. The positional offsets are from |
| In the text | |
|
Fig. 6 W51 IRS2. Upper panel: overlay of the 25 GHz continuum emission imaged with the JVLA (gray scale and white contours) and the SiO v = 0J = 5–4 0th moment image from the SMA (blue and red contours; Zapata et al. 2009a). The 25 GHz continuum contours indicate 1 and 3 mJy flux levels per beam, respectively (the peak is ~160 mJy beam-1 and the rms is 0.4 mJy beam-1). The SiO 5−4 line contours are from 20% to 90% with steps of 10% of the line peak (5230 Jy beam-1 km s-1 for the red contours and 8744 Jy beam-1 km s-1 for the blue contours). Blue and red contours correspond to blue- and redshifted gas, with integrated velocity ranging from +20 to +58 km s-1 and from +60 to +95 km s-1, respectively. The synthesized beam of the JVLA image is 0.28′′ × 0.24′′, whereas that of the SMA is 0.58′′ × 0.43′′. The dashed white box indicates the zoomed area plotted in the lower panel. Lower panel: overlay of the SO2 [222,20 → 221,21] 0th moment emission imaged with the SMA at 0.̋4 resolution (color image and black contours) with the (10, 10) and (13, 13) thermal NH3 emission (blue and red contours, respectively), as well as several masers observed in W51-North. The integrated velocity range for SO2 is from +50 to +70 km s-1 and the contours are from 30% to 100% with steps of 10% of the line peak (7.8 Jy beam-1 km s-1). The NH3 contours are 30%, 60%, 90% of the line peak for the (10, 10) line (66 mJy beam-1 km s-1) and the (13, 13) line (65 mJy beam-1 km s-1). The black triangles mark the position of the water maser spots observed with the VLA, while the white cross sign marks the centroid position of SiO masers imaged with the VLBA, ( |
| In the text | |
|
Fig. 7 Overlay of the integrated flux of the NH3 (J,K) = (3, 3) line (color image) with the positions of known NH3 masers measured with interferometry (black plus signs) in the W51 IRS2 region. The NH3 (3, 3) map was made with the VLA-C configuration at 1.̋2 resolution (Zhang & Ho 1995). The color scales are linear from 0 to 700 mJy beam-1 km s-1. Positions of the NH3 masers from doublets (J,K) = (3, 3) (Zhang & Ho 1995), (9, 8) (Wilson et al. 1991), (6, 6), (7, 7), (9, 9) (this study), are indicated in the map. The numbers next to the plus signs indicate the maser peak velocities in km s-1. |
| In the text | |
Current usage metrics show cumulative count of Article Views (full-text article views including HTML views, PDF and ePub downloads, according to the available data) and Abstracts Views on Vision4Press platform.
Data correspond to usage on the plateform after 2015. The current usage metrics is available 48-96 hours after online publication and is updated daily on week days.
Initial download of the metrics may take a while.