Fig. 4
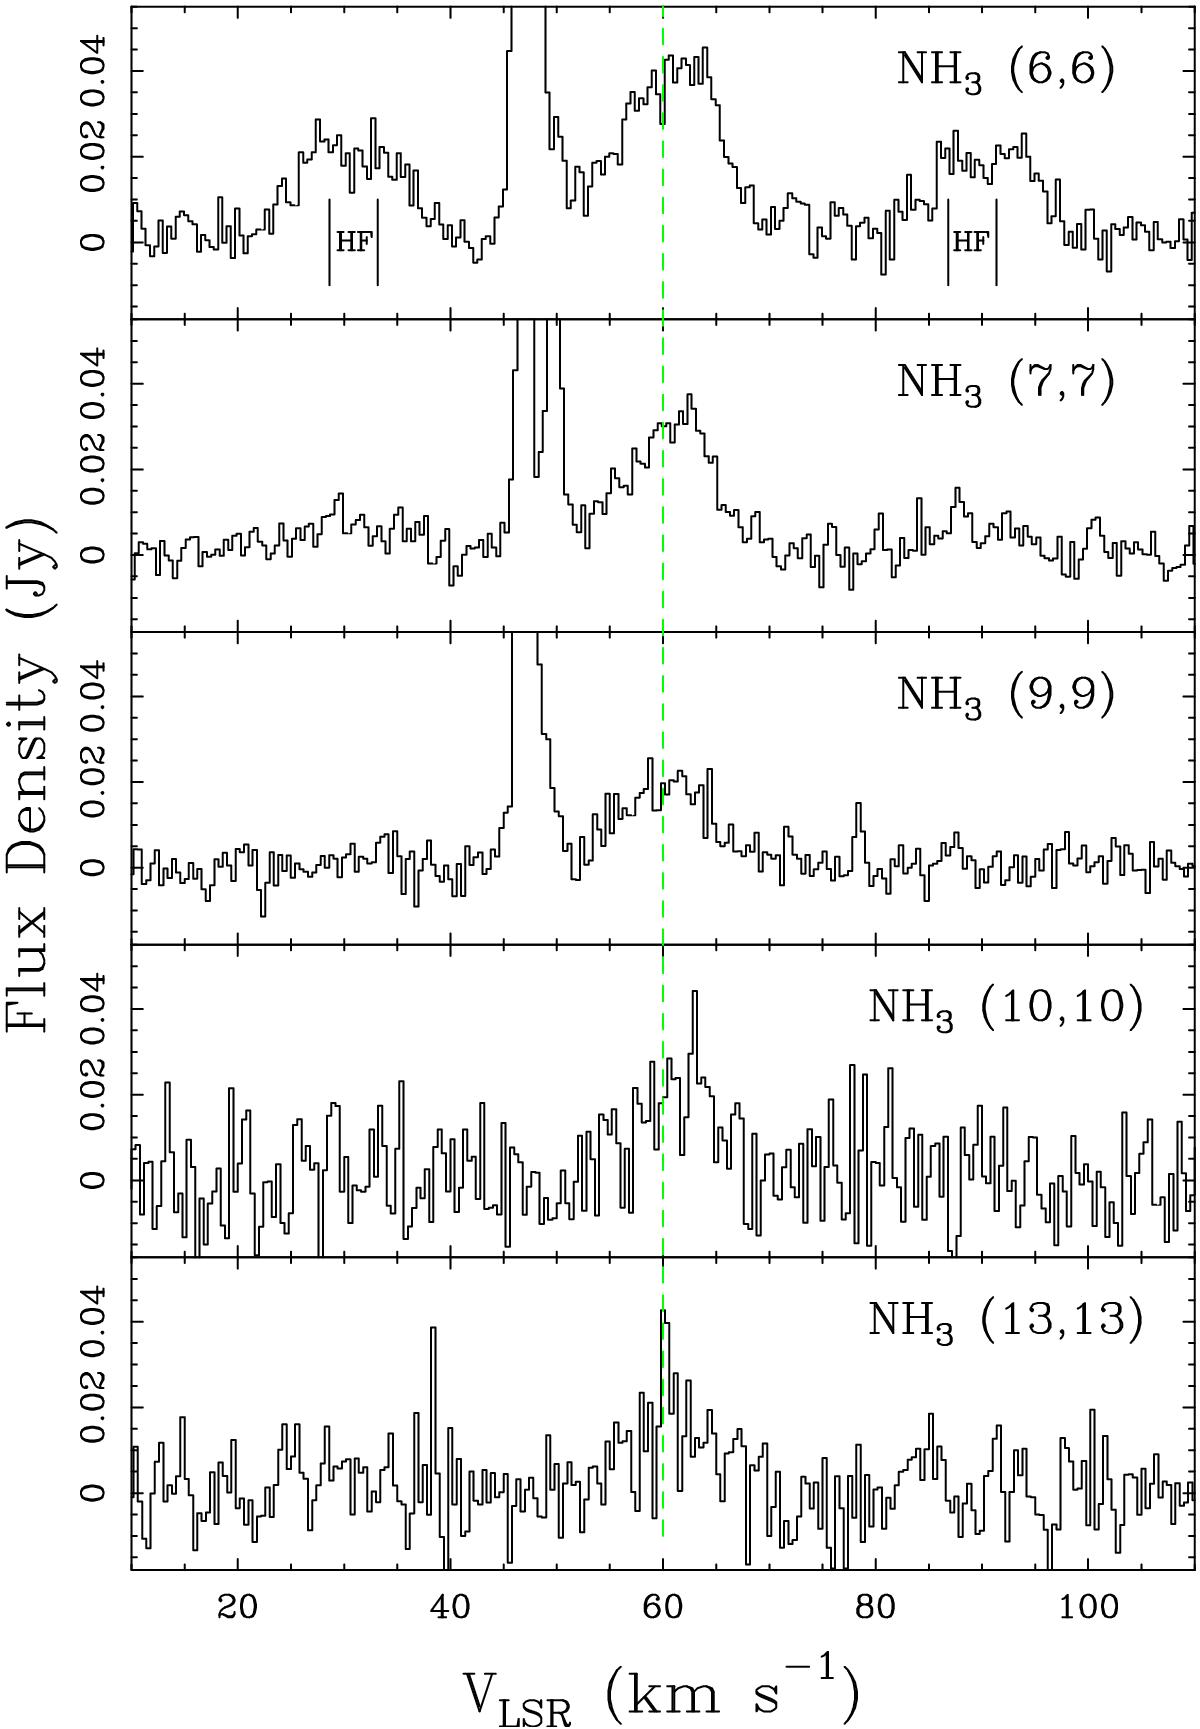
Spectral profiles of the thermal (and maser) emission from the metastable NH3 (6, 6), (7, 7), (9, 9), (10, 10), and (13, 13) inversion transitions, integrated in a region with size of 0.̋8 around the maser position. The spectra shown here are the same as in Fig. 3, but with a narrower flux density and a wider velocity range to highlight the weaker thermal emission. The vertical dashed line indicates a velocity of 60 km s-1. The velocity resolution is 0.4 km s-1. We note that the hyperfine satellite lines (separated by ~ ± 27 − 31 km s-1) are clearly detected for the (6, 6) line (indicated with black vertical lines), but they are also still visible in the (7, 7) spectrum. The upper state energy levels of transitions shown here are ~408−1691 K (see Table 1).
Current usage metrics show cumulative count of Article Views (full-text article views including HTML views, PDF and ePub downloads, according to the available data) and Abstracts Views on Vision4Press platform.
Data correspond to usage on the plateform after 2015. The current usage metrics is available 48-96 hours after online publication and is updated daily on week days.
Initial download of the metrics may take a while.