Fig. 6
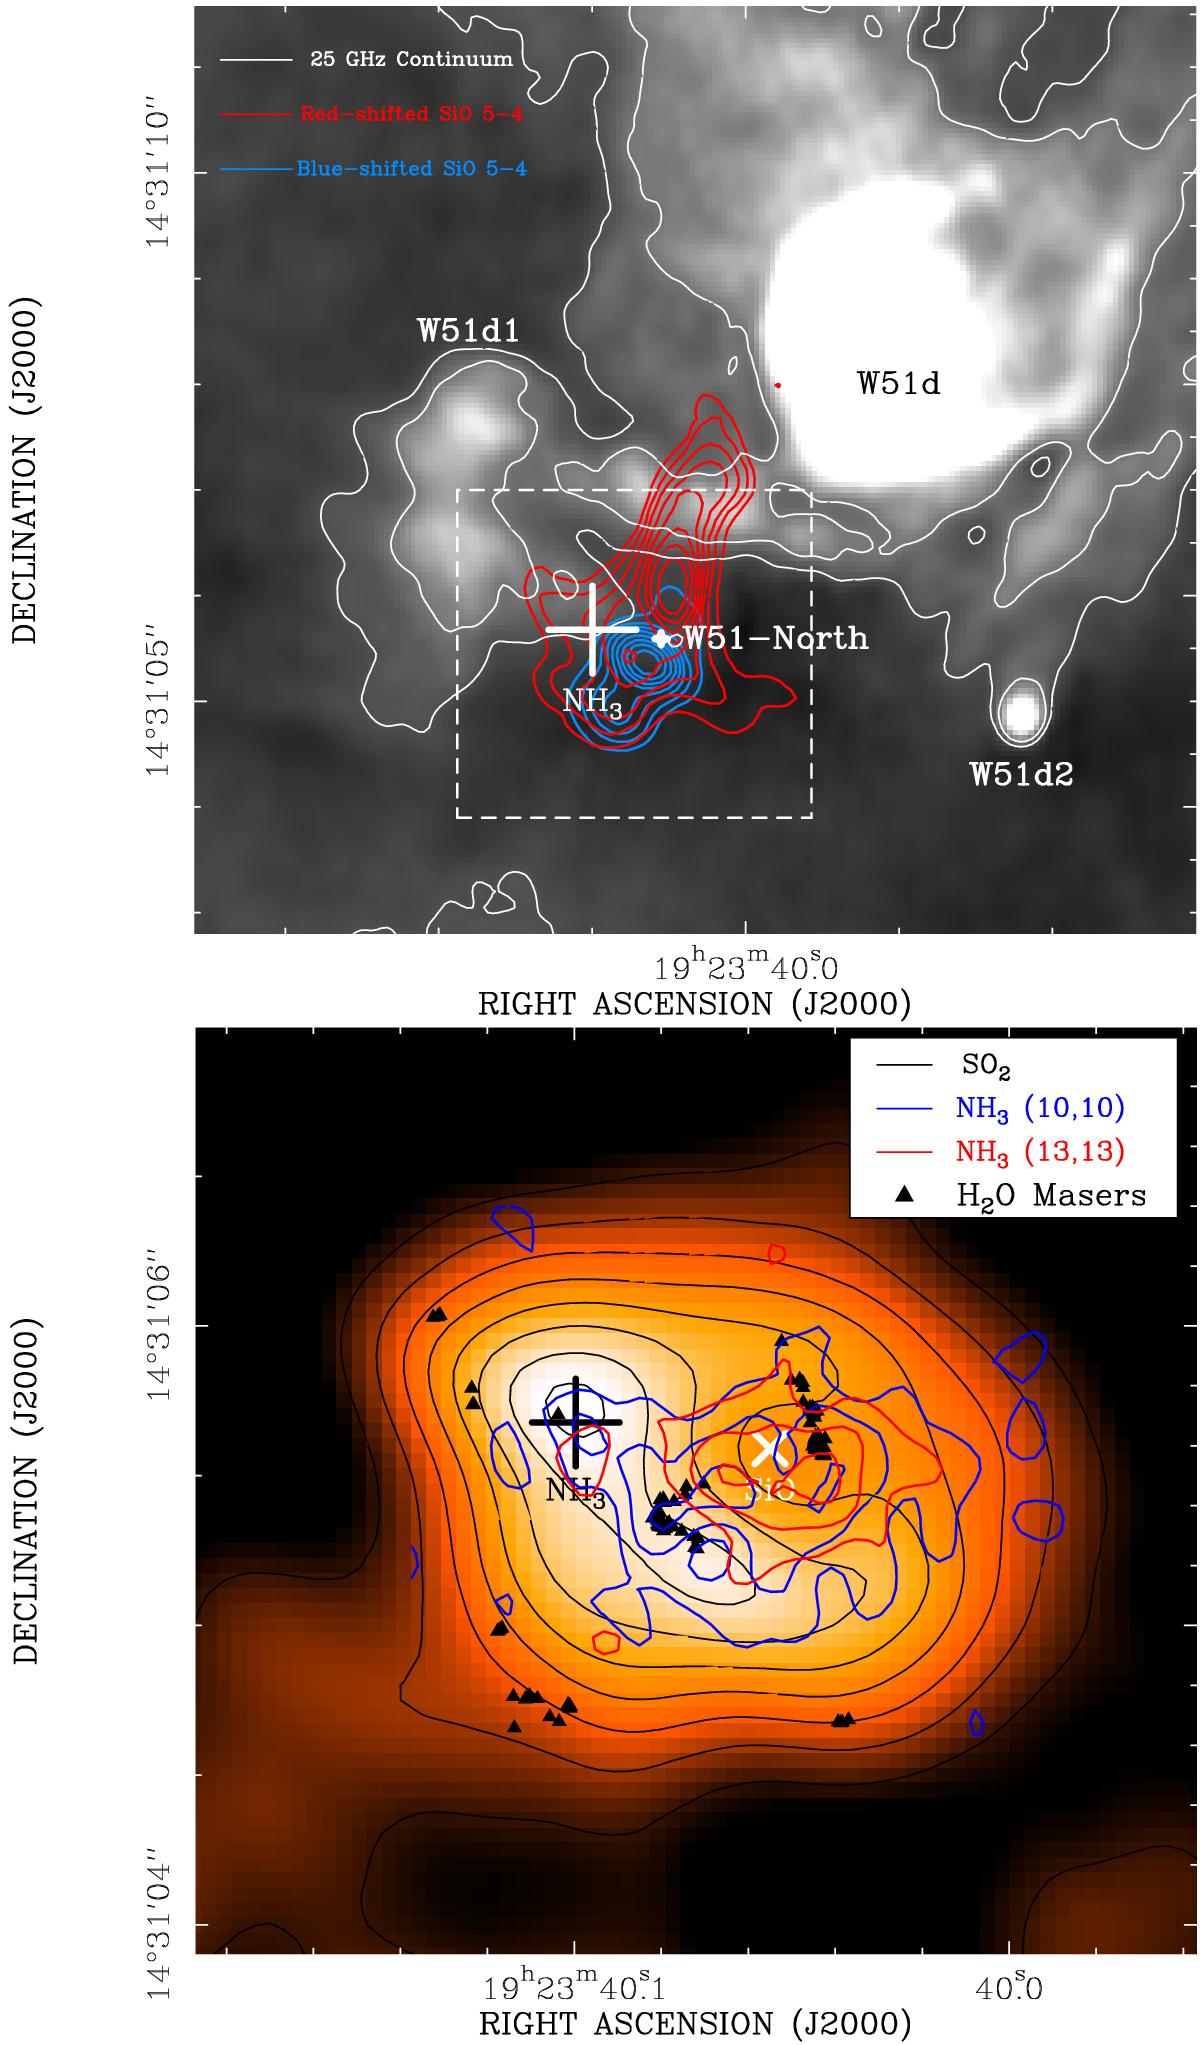
W51 IRS2. Upper panel: overlay of the 25 GHz continuum emission imaged with the JVLA (gray scale and white contours) and the SiO v = 0J = 5–4 0th moment image from the SMA (blue and red contours; Zapata et al. 2009a). The 25 GHz continuum contours indicate 1 and 3 mJy flux levels per beam, respectively (the peak is ~160 mJy beam-1 and the rms is 0.4 mJy beam-1). The SiO 5−4 line contours are from 20% to 90% with steps of 10% of the line peak (5230 Jy beam-1 km s-1 for the red contours and 8744 Jy beam-1 km s-1 for the blue contours). Blue and red contours correspond to blue- and redshifted gas, with integrated velocity ranging from +20 to +58 km s-1 and from +60 to +95 km s-1, respectively. The synthesized beam of the JVLA image is 0.28′′ × 0.24′′, whereas that of the SMA is 0.58′′ × 0.43′′. The dashed white box indicates the zoomed area plotted in the lower panel. Lower panel: overlay of the SO2 [222,20 → 221,21] 0th moment emission imaged with the SMA at 0.̋4 resolution (color image and black contours) with the (10, 10) and (13, 13) thermal NH3 emission (blue and red contours, respectively), as well as several masers observed in W51-North. The integrated velocity range for SO2 is from +50 to +70 km s-1 and the contours are from 30% to 100% with steps of 10% of the line peak (7.8 Jy beam-1 km s-1). The NH3 contours are 30%, 60%, 90% of the line peak for the (10, 10) line (66 mJy beam-1 km s-1) and the (13, 13) line (65 mJy beam-1 km s-1). The black triangles mark the position of the water maser spots observed with the VLA, while the white cross sign marks the centroid position of SiO masers imaged with the VLBA, (![]() , 14°31′5.̋59), as reported in Eisner et al. (2002). The black plus sign marks the position of the NH3 masers detected in this study with the JVLA. We note that the images displayed are not corrected for primary beam effects.
, 14°31′5.̋59), as reported in Eisner et al. (2002). The black plus sign marks the position of the NH3 masers detected in this study with the JVLA. We note that the images displayed are not corrected for primary beam effects.
Current usage metrics show cumulative count of Article Views (full-text article views including HTML views, PDF and ePub downloads, according to the available data) and Abstracts Views on Vision4Press platform.
Data correspond to usage on the plateform after 2015. The current usage metrics is available 48-96 hours after online publication and is updated daily on week days.
Initial download of the metrics may take a while.