Fig. 1
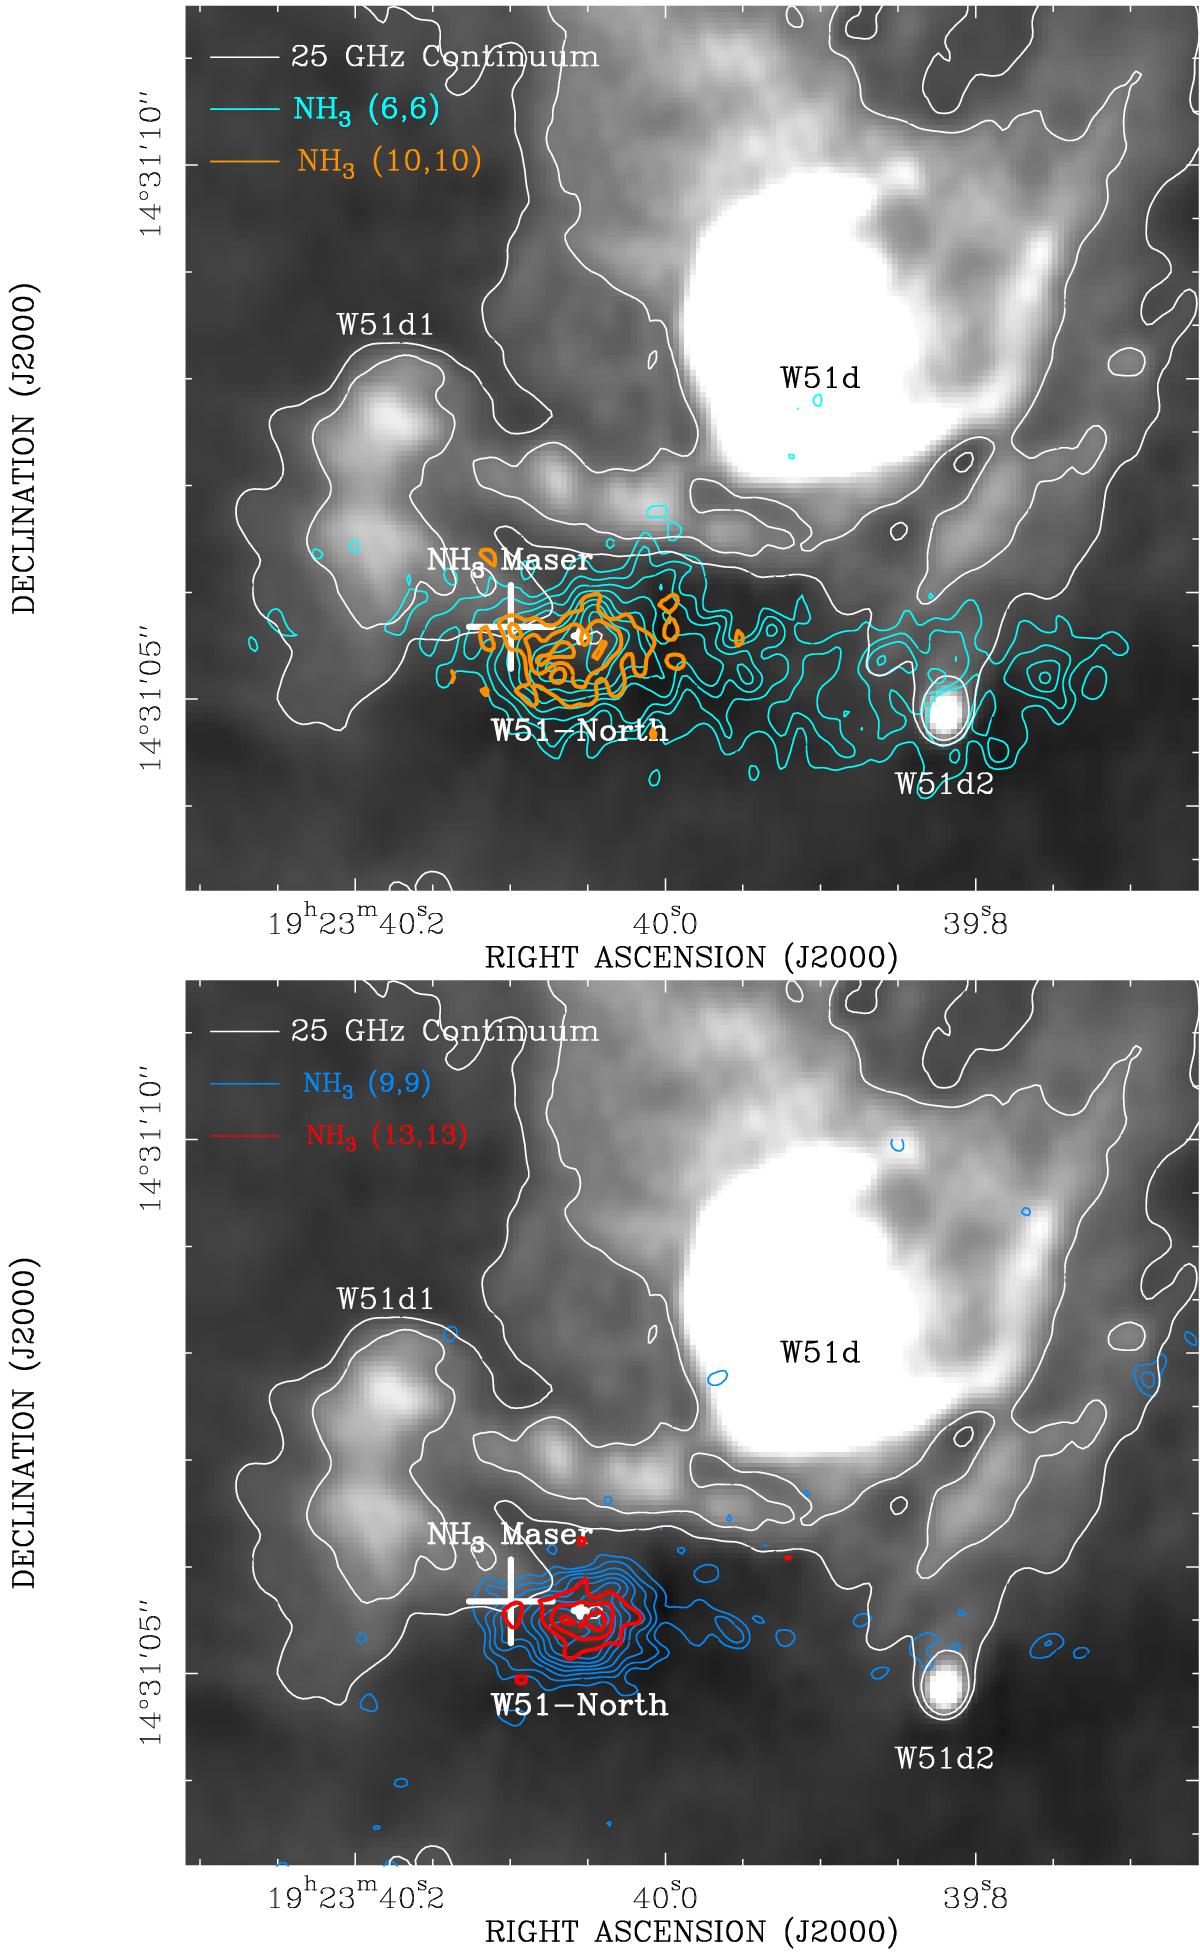
Overlay of the 25 GHz continuum emission (gray scale and white contours) and the 0th moment images of the NH3 (6, 6), (9, 9), (10, 10), and (13, 13) thermal emission lines (cyan, blue, orange, and red contours, respectively) imaged with the JVLA in W51 IRS2. The 25 GHz continuum contours indicate 1 and 3 mJy flux levels per beam, respectively (the peak is ~160 mJy beam-1 and the rms is 0.4 mJy beam-1). The NH3 contours are 20% to 100% with steps of 10% of the line peak for the (6, 6) line (119 mJy beam-1 km s-1) and the (9, 9) line (63 mJy beam-1 km s-1), and 30%, 60%, 90% of the line peak for the (10, 10) (66 mJy beam-1 km s-1) and the (13, 13) lines (65 mJy beam-1 km s-1). The intensity was integrated in the velocity range from 50.3 to 70.7 km s-1 for the (6, 6) line, +50.4 to +66.0 km s-1 for the (9, 9) line, +50.2 to +66.2 km s-1 for the (10, 10) line, and +50.0 to +66.8 km s-1 for the (13, 13) line, respectively. The big white plus marks the position of the (6, 6), (7, 7), and (9, 9) NH3 masers. The small white plus marks the position of the W51-North protostar as inferred from SiO masers (Eisner et al. 2002). We note that the most highly excited lines, the (10, 10) and (13, 13) transitions, show a peak at the NH3 maser position. The images displayed are not corrected for primary beam effects.
Current usage metrics show cumulative count of Article Views (full-text article views including HTML views, PDF and ePub downloads, according to the available data) and Abstracts Views on Vision4Press platform.
Data correspond to usage on the plateform after 2015. The current usage metrics is available 48-96 hours after online publication and is updated daily on week days.
Initial download of the metrics may take a while.