Fig. 5
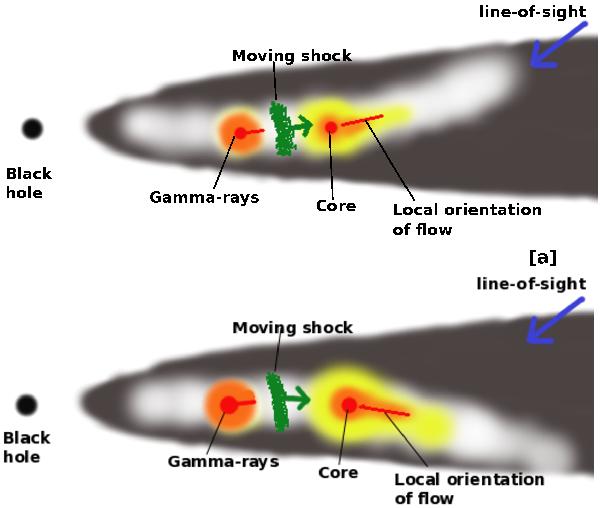
Sketch for the proposed scenario in the BL Lac S5 0716+714 (not to scale). The high-density/pressure regions, shown in light gray (superimposed on the underlying jet flow, which is in dark), brighten relative to other regions of the jet by the passage of a moving shock. a) Case for a strong correlation; and b) a weak correlation.
Current usage metrics show cumulative count of Article Views (full-text article views including HTML views, PDF and ePub downloads, according to the available data) and Abstracts Views on Vision4Press platform.
Data correspond to usage on the plateform after 2015. The current usage metrics is available 48-96 hours after online publication and is updated daily on week days.
Initial download of the metrics may take a while.