Free Access
Fig. 3
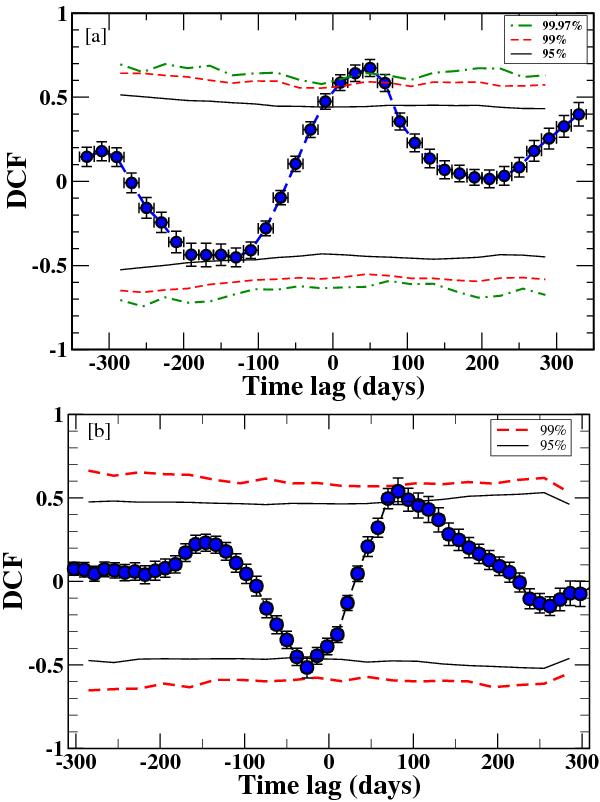
a) DCF analysis curve of the γ-ray flux and PA variations in the inner jet region. The lines show confidence levels as discussed in the text. b) DCF analysis curve between the γ-ray and core flux density variations. A positive time lag implies that γ-ray flux variations lead core flux density and PA variations.
Current usage metrics show cumulative count of Article Views (full-text article views including HTML views, PDF and ePub downloads, according to the available data) and Abstracts Views on Vision4Press platform.
Data correspond to usage on the plateform after 2015. The current usage metrics is available 48-96 hours after online publication and is updated daily on week days.
Initial download of the metrics may take a while.