Fig. 1
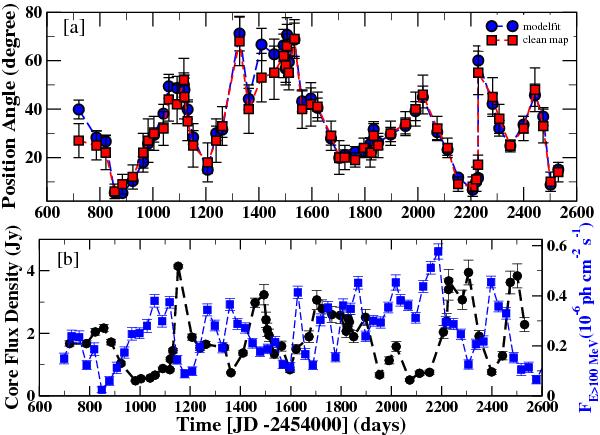
a) Position angle (PA) variations in the central region of the jet. The blue circles show the PA calculated using model-fitting, while those estimated directly from clean maps are in red (square symbols). b) mm-VLBI core flux density variations (black circles) over the same time period superimposed with the monthly averaged γ-ray flux variations (blue squares).
Current usage metrics show cumulative count of Article Views (full-text article views including HTML views, PDF and ePub downloads, according to the available data) and Abstracts Views on Vision4Press platform.
Data correspond to usage on the plateform after 2015. The current usage metrics is available 48-96 hours after online publication and is updated daily on week days.
Initial download of the metrics may take a while.