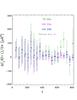
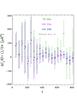
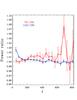
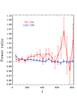
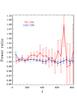
Fig. 6
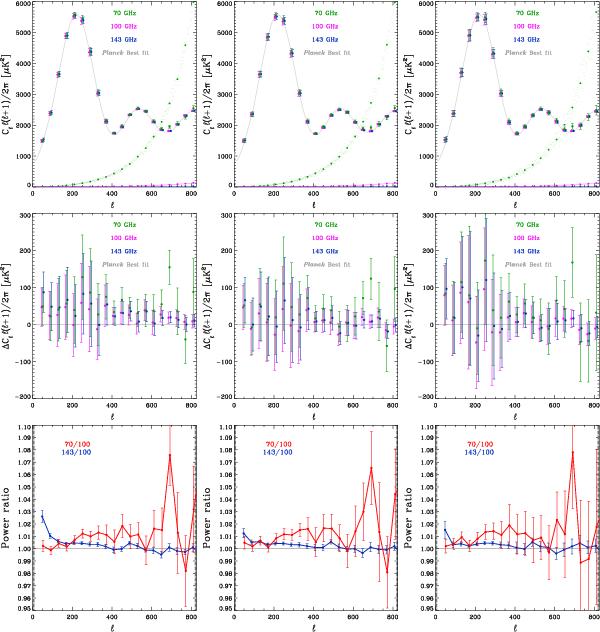
Spectral analysis of the Planck 70, 100, and 143 GHz maps. Columns show results computed using the three sky masks in Fig. 1, with, from left to right, fsky = 69.4%, 59.6%, and 39.7%. Top row: CMB anisotropy spectra binned over a range of multipoles Δℓ = 40, for ℓ ≥ 30, with (2ℓ + 1)-weighting applied within the bin. Error bars are computed as a measure of the rms-power within each bin, and hence comprise both the measurement inaccuracy and cosmic variance. The grey curve is the best-fit Planck 6-parameter ΛCDM model from Planck Collaboration XVI (2014). Noise spectra computed from the half-ring-difference maps are shown: for the 70 GHz channel, the S/N ≈ 1 at ℓ ≈ 650. Middle row: residuals of the same power spectra with respect to the Planck best-fit model. Bottom row: power ratios for the 70 vs. 100 GHz and 143 vs. 100 GHz channels of Planck. The ratios are calculated ℓ by ℓ, then binned. The error bars show the standard error of the mean for the bin. The effect of diffuse foregrounds is clearly seen in the changes in the 143/100 ratio with sky fraction at ℓ ≈ 100. Bin-to-bin variations in the exact values of the ratios with sky fraction emphasize the importance of making such comparisons precisely.

Current usage metrics show cumulative count of Article Views (full-text article views including HTML views, PDF and ePub downloads, according to the available data) and Abstracts Views on Vision4Press platform.
Data correspond to usage on the plateform after 2015. The current usage metrics is available 48-96 hours after online publication and is updated daily on week days.
Initial download of the metrics may take a while.