Fig. 5
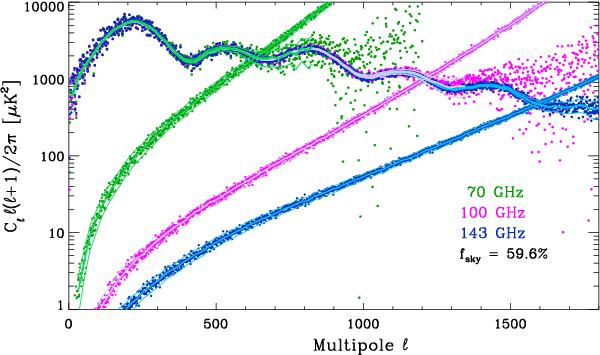
Planck 70, 100, and 143 GHz CMB anisotropy power spectra computed
for the GAL060 mask. Mask- and beam-deconvolved cross-spectra of the half-ring maps
show the signal; auto-correlation spectra of the half-ring difference maps show the
noise. Points show single multipoles up to ℓ = 1200 for 70 GHz
and ℓ =
1700 for 100 and 143 GHz. Heavy solid lines show Δℓ = 20 boxcar
averages. The S/N near the first peak (ℓ = 220) is approximately 80, 1900, and 6000
for 70, 100, and 143 GHz, respectively. Noise power is calculated according to the
large-ℓ approximation, i.e., as a
![]() distribution with mean
Cℓ and rms
Cℓ [
fsky(2ℓ + 1)/2 ] −
1/2. Pairs of thin lines mark ± 3σ bands of noise
power around the noise spectra. We translate this statistical spread of noise power
Cℓs into the
signal spectra estimated via half-ring map cross-spectra. Under the simplifying
assumption that each Cℓ of the noise
in the cross-spectrum at high-ℓ is distributed as a sum of (2ℓ + 1) products of
independent Gaussian deviates, each with variance
distribution with mean
Cℓ and rms
Cℓ [
fsky(2ℓ + 1)/2 ] −
1/2. Pairs of thin lines mark ± 3σ bands of noise
power around the noise spectra. We translate this statistical spread of noise power
Cℓs into the
signal spectra estimated via half-ring map cross-spectra. Under the simplifying
assumption that each Cℓ of the noise
in the cross-spectrum at high-ℓ is distributed as a sum of (2ℓ + 1) products of
independent Gaussian deviates, each with variance
![]() derived from the half-ring
difference maps, the Gaussianized high-ℓ noise in the cross-spectra has zero mean
and rms of
derived from the half-ring
difference maps, the Gaussianized high-ℓ noise in the cross-spectra has zero mean
and rms of ![]() . Pairs of thin lines mark
± 1σ
bands of noise around the boxcar-averaged cross-spectra.
. Pairs of thin lines mark
± 1σ
bands of noise around the boxcar-averaged cross-spectra.
Current usage metrics show cumulative count of Article Views (full-text article views including HTML views, PDF and ePub downloads, according to the available data) and Abstracts Views on Vision4Press platform.
Data correspond to usage on the plateform after 2015. The current usage metrics is available 48-96 hours after online publication and is updated daily on week days.
Initial download of the metrics may take a while.