Fig. 4
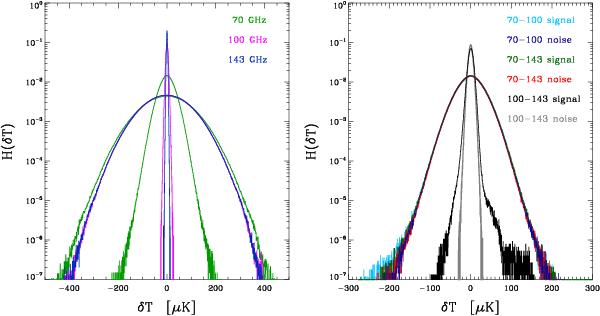
Signal and noise for the frequency maps of Fig. 2 (left panel) and the difference maps of Fig. 3 (right panel), with the 59.6% mask in all cases. The broader, signal+noise curves are nearly Gaussian due to the dominant CMB anisotropies. The 70 GHz curve is broader than the 100 and 143 GHz curves because of the higher noise level, but is still signal-dominated for | dT/T | ≳ 50 μK. The narrower noise curves, derived from the half-ring difference maps, are not Gaussian because of the scanning-induced spatial dependence of pixel noise in Planck maps. The considerably higher noise level of the 70 GHz map is again apparent. The histograms of the difference maps show noise domination near the peak of each pair of curves (the signal+noise and noise curves overlap). The pairs involving 70 GHz are wider and dominated by the 70 GHz noise, but the wings at low pixel counts show the signature of foregrounds that exceed the noise levels, primarily dust and CO emission in the negative wing, and free-free and synchrotron emission in the positive wing. In the low-noise 100 minus 143 GHz pairs, the signal, due mostly to dust emission in the negative wing and to free-free and CO residuals in the positive wing, stands out clearly from the noise.
Current usage metrics show cumulative count of Article Views (full-text article views including HTML views, PDF and ePub downloads, according to the available data) and Abstracts Views on Vision4Press platform.
Data correspond to usage on the plateform after 2015. The current usage metrics is available 48-96 hours after online publication and is updated daily on week days.
Initial download of the metrics may take a while.