Fig. 3
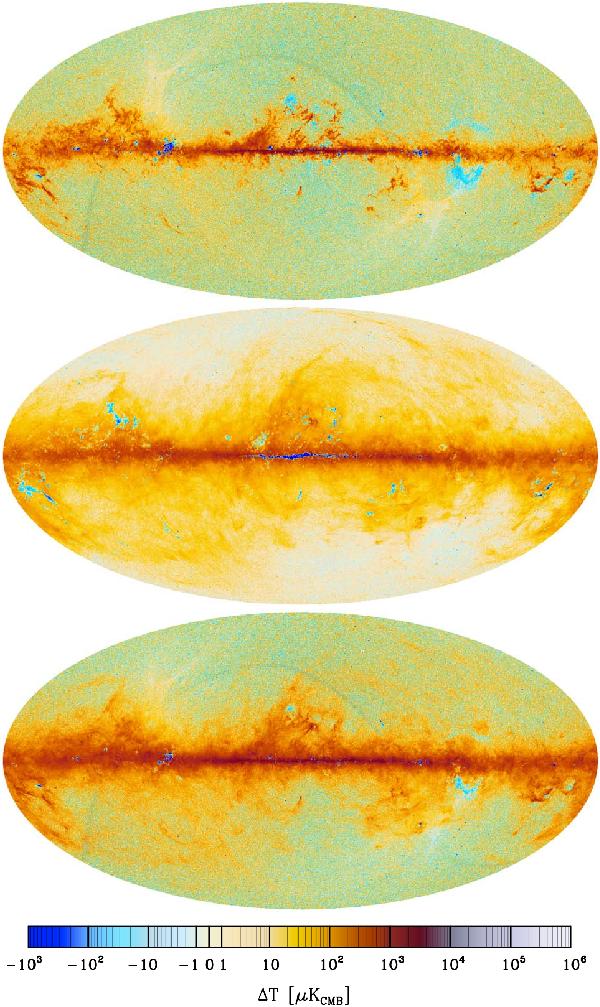
Difference maps. Top: 100 GHz minus 70 GHz. Middle: 143 GHz minus 100 GHz. Bottom: 143 GHz minus 70 GHz. All sky maps are smoothed to angular resolution FWHM = 15′ by a filter that accounts for the difference between the effective beam response at each frequency and a Gaussian of FWHM 15′. These maps illustrate clearly the difference in the noise level of the individual maps, excellent overall nulling of the CMB anisotropy signal, and frequency-dependent foregrounds. The 100–70 difference shows predominantly CO (J = 0 → 1) emission (positive) and free-free emission (negative). The 143–100 difference shows dust emission (positive) and CO emission (negative). The 143–70 difference shows dust emission (positive) and free-free emission (negative). The darker stripe in the top and bottom maps is due to reduced integration time in the 70 GHz channel in the first days of observation (see Planck Collaboration II 2014, Sect. 9.5).
Current usage metrics show cumulative count of Article Views (full-text article views including HTML views, PDF and ePub downloads, according to the available data) and Abstracts Views on Vision4Press platform.
Data correspond to usage on the plateform after 2015. The current usage metrics is available 48-96 hours after online publication and is updated daily on week days.
Initial download of the metrics may take a while.