Fig. C.2
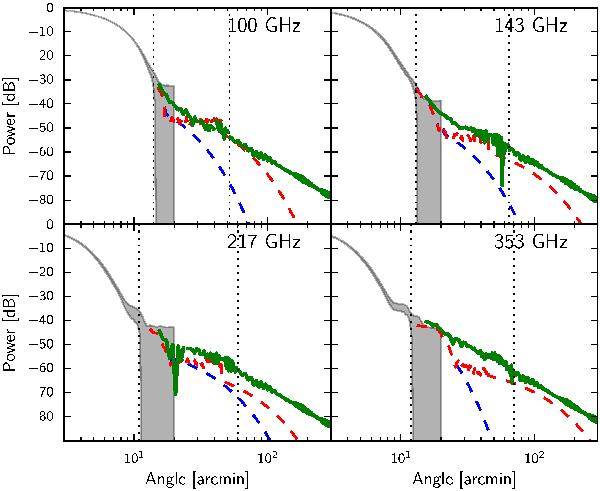
HFI beam and planet measurement profiles. The grey shaded region shows the 1σ errors in the nominal beam profile used to make the effective beam window function. The dashed blue and red lines are the best-case and worst-case near sidelobe estimates from Jupiter, presented in Fig. 10 of Planck Collaboration VII (2014). The solid green curve is the hybrid beam profile used to derive correction factors here. The vertical dotted lines indicate the radial extent of each portion of the hybrid beam: the nominal beam is at small angles; at intermediate angles Jupiter data are used; and at large angles the scaled GRASP simulation is used.
Current usage metrics show cumulative count of Article Views (full-text article views including HTML views, PDF and ePub downloads, according to the available data) and Abstracts Views on Vision4Press platform.
Data correspond to usage on the plateform after 2015. The current usage metrics is available 48-96 hours after online publication and is updated daily on week days.
Initial download of the metrics may take a while.