Fig. A.1
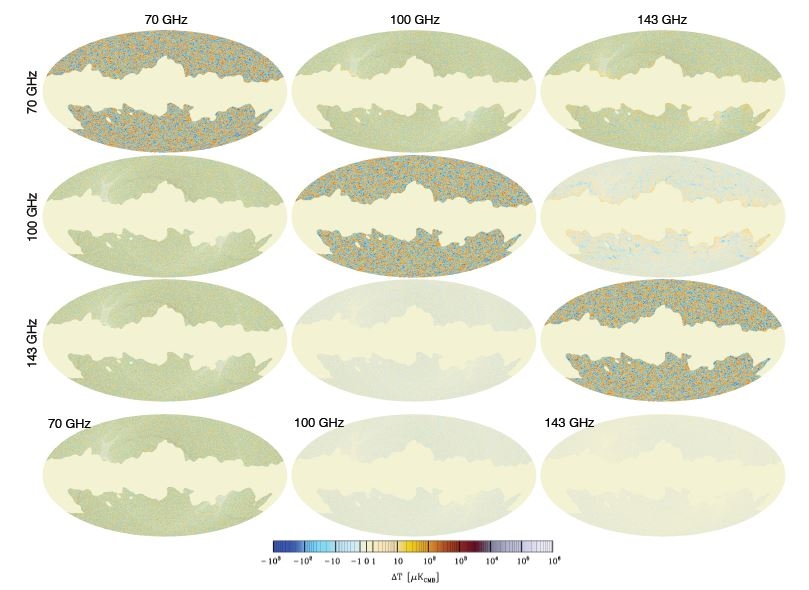
Frequency maps and difference maps using the GAL060 mask. Rms values are given in Table 1; histograms are shown in Fig. 4. In the top 3 × 3 group, the frequency maps are on the diagonal. The three frequency difference maps are in the upper right block. The noise difference maps are in the lower left block. The bottom row gives the single-frequency noise maps. The caption of Fig. 4 describes characteristics of the histograms that can also be seen quite clearly in these maps. The three upper right maps are the same as the three in Fig. 3, but with structure on scales larger than 8° removed, as described in the text.
Current usage metrics show cumulative count of Article Views (full-text article views including HTML views, PDF and ePub downloads, according to the available data) and Abstracts Views on Vision4Press platform.
Data correspond to usage on the plateform after 2015. The current usage metrics is available 48-96 hours after online publication and is updated daily on week days.
Initial download of the metrics may take a while.