Fig. 15
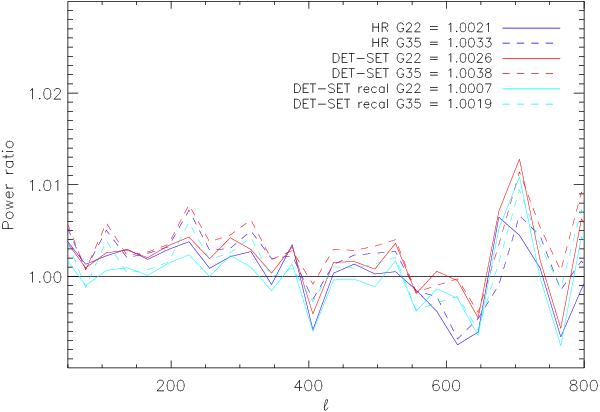
Effects on the 143/100 ratio of changes in the mask, choice of detectors, and detector recalibration. Solid lines indicate ratios calculated with mask G22; dashed lines indicate mask G35. Use of detector sets gives the cyan curves with recalibration turned on and the red curves with recalibration turned off. Use of full-frequency half-ring cross spectra, as in Sect. 3, gives the blue curves. The cyan curves are comparable to the green curves in Fig. 14, which also have intra-frequency calibration and foreground corrections applied. The blue-dashed curve agrees extremely well with the blue curve in the bottom right panel of Fig. 6, as it should (see text).
Current usage metrics show cumulative count of Article Views (full-text article views including HTML views, PDF and ePub downloads, according to the available data) and Abstracts Views on Vision4Press platform.
Data correspond to usage on the plateform after 2015. The current usage metrics is available 48-96 hours after online publication and is updated daily on week days.
Initial download of the metrics may take a while.