Fig. E.4
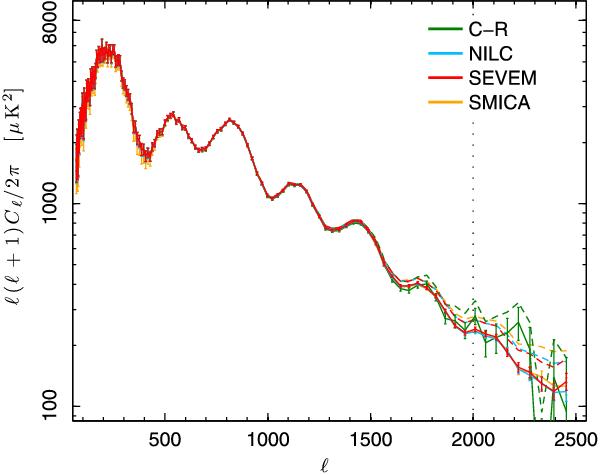
Estimates of the CMB power spectra from the foreground-cleaned FFP6 maps, computed by XFaster. The solid lines show the spectra after subtracting the best-fit model of residual foregrounds. The vertical dotted line shows the maximum multipole (ℓ = 2000) used in the likelihood for fitting the foreground model and cosmological parameters (see Sect. E.3 for further details). The dashed lines show the spectra before residual foreground subtraction.
Current usage metrics show cumulative count of Article Views (full-text article views including HTML views, PDF and ePub downloads, according to the available data) and Abstracts Views on Vision4Press platform.
Data correspond to usage on the plateform after 2015. The current usage metrics is available 48-96 hours after online publication and is updated daily on week days.
Initial download of the metrics may take a while.