Fig. 6
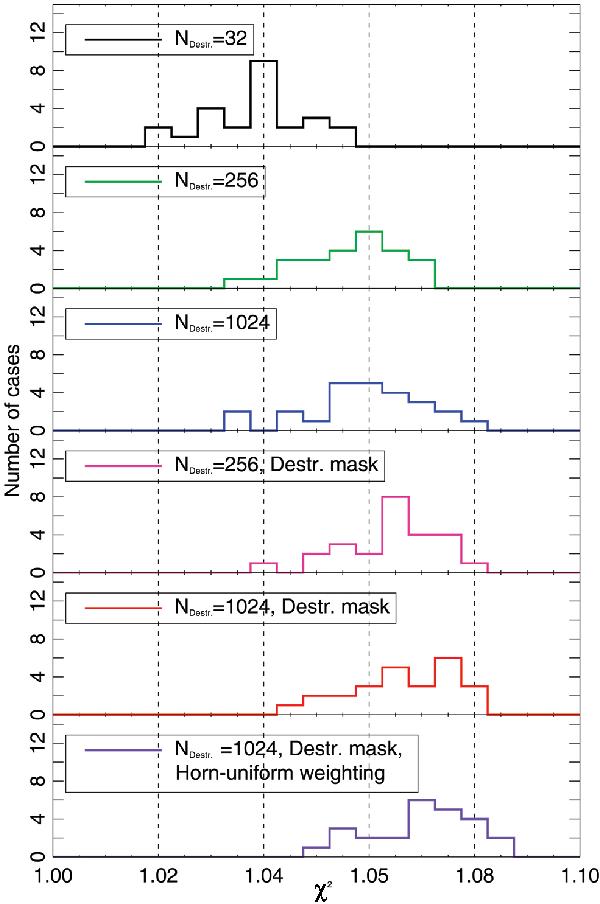
Reduced χ2 statistics from 25 noise-only maps for the 30 GHz 2013 delivery. The NCVM was calculated using 0.25 s baselines, while the simulations were made with 0.5 s baselines. The number of idealizations in the noise-only simulations decreases from top to bottom. The first set of simulations (plotted in black) contains the same approximations that are made in the NCVM calculation. The last set of simulations (plotted in purple) corresponds to the standard mapmaking options: the horns are weighted uniformly; destriping resolution, NDestr., is 1024; and a destriping mask is applied.
Current usage metrics show cumulative count of Article Views (full-text article views including HTML views, PDF and ePub downloads, according to the available data) and Abstracts Views on Vision4Press platform.
Data correspond to usage on the plateform after 2015. The current usage metrics is available 48-96 hours after online publication and is updated daily on week days.
Initial download of the metrics may take a while.