Free Access
Fig. 17
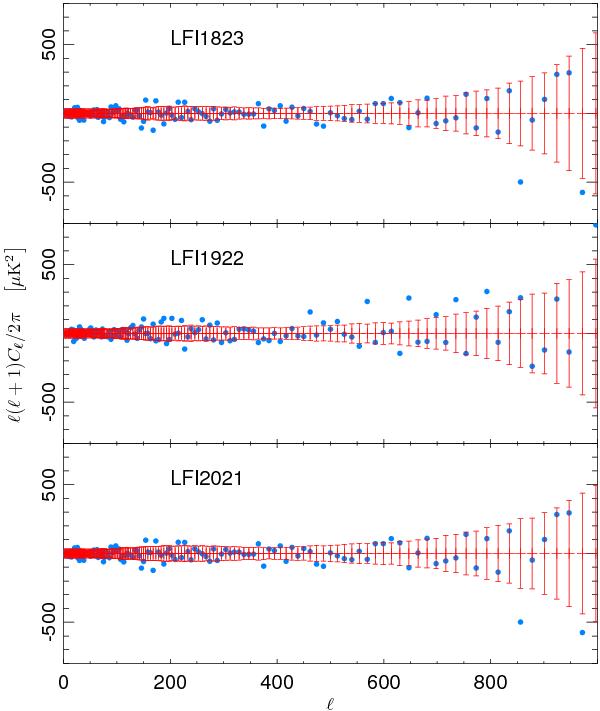
Residuals between the auto-spectra of the horn pair maps and the power spectrum of the full 70 GHz frequency map. Error bars are derived from the FFP6 simulations.
Current usage metrics show cumulative count of Article Views (full-text article views including HTML views, PDF and ePub downloads, according to the available data) and Abstracts Views on Vision4Press platform.
Data correspond to usage on the plateform after 2015. The current usage metrics is available 48-96 hours after online publication and is updated daily on week days.
Initial download of the metrics may take a while.