Fig. 11
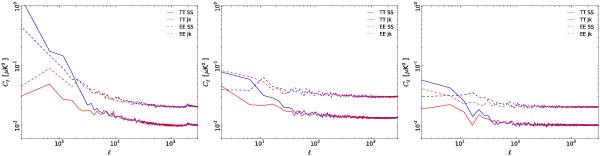
Null-test results comparing power spectra from survey difference maps (SS) to those from half-ring difference maps (h). Some excess at low multipoles is clearly visible at 30 GHz (left), where the main source has been identified as sidelobe pickup. At 44 (centre) and 70 GHz (right), there is less low-ℓ contribution both in TT and in EE, although residuals are still present. For multipoles larger than few tens, null-test EE spectra follow the expected level of noise as traced by half-ring differences.
Current usage metrics show cumulative count of Article Views (full-text article views including HTML views, PDF and ePub downloads, according to the available data) and Abstracts Views on Vision4Press platform.
Data correspond to usage on the plateform after 2015. The current usage metrics is available 48-96 hours after online publication and is updated daily on week days.
Initial download of the metrics may take a while.