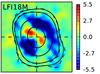
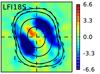
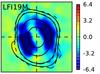
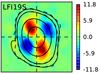
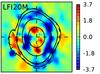
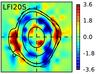
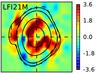
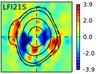
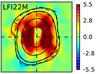
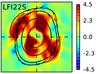
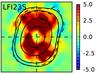
Fig. 6
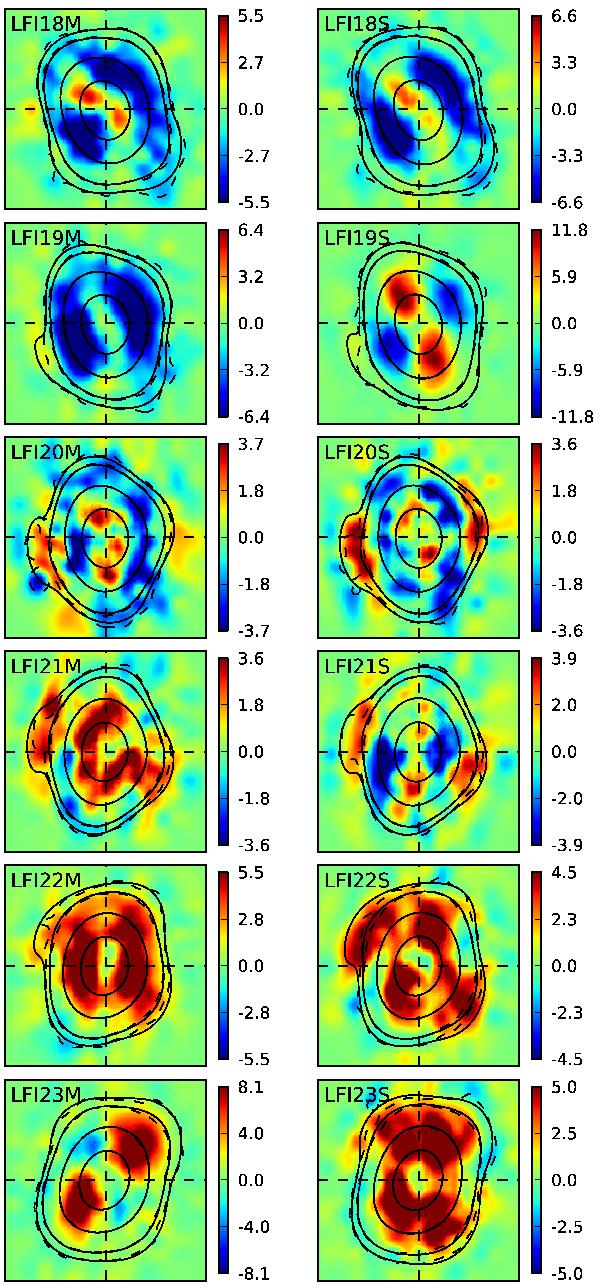
Difference between measured (dashed line) scanning beams and simulated (solid line) beams (70 GHz channel). The color scale spans 2.25 times the rms of the beam difference and the units of the color bar are in thousandths of the peak height, i.e., 0.1% of the beam maximum. The contours correspond to –3, –10, –20, and –25 dB from the peak. The size of each patch is 50′ × 50′, centered along the beam line of sight.

Current usage metrics show cumulative count of Article Views (full-text article views including HTML views, PDF and ePub downloads, according to the available data) and Abstracts Views on Vision4Press platform.
Data correspond to usage on the plateform after 2015. The current usage metrics is available 48-96 hours after online publication and is updated daily on week days.
Initial download of the metrics may take a while.