Fig. 22
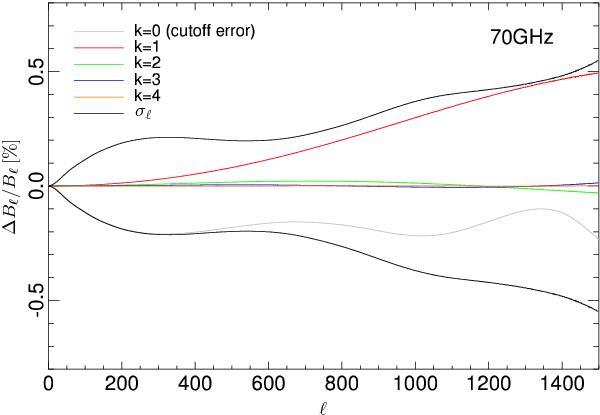
Error budget for the 70 GHz channel relative to the fiducial Bℓ. The grey curve represents the error between the full beam and the cutoff approximation used in the window function computations. The colored lines represent the first four modes used in the current beam error model, as described in Sect. 5.3. The black line is the one − σ error obtained by adding the cutoff error and the squared first four eigenmodes.
Current usage metrics show cumulative count of Article Views (full-text article views including HTML views, PDF and ePub downloads, according to the available data) and Abstracts Views on Vision4Press platform.
Data correspond to usage on the plateform after 2015. The current usage metrics is available 48-96 hours after online publication and is updated daily on week days.
Initial download of the metrics may take a while.