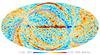
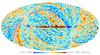
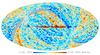
Fig. 10
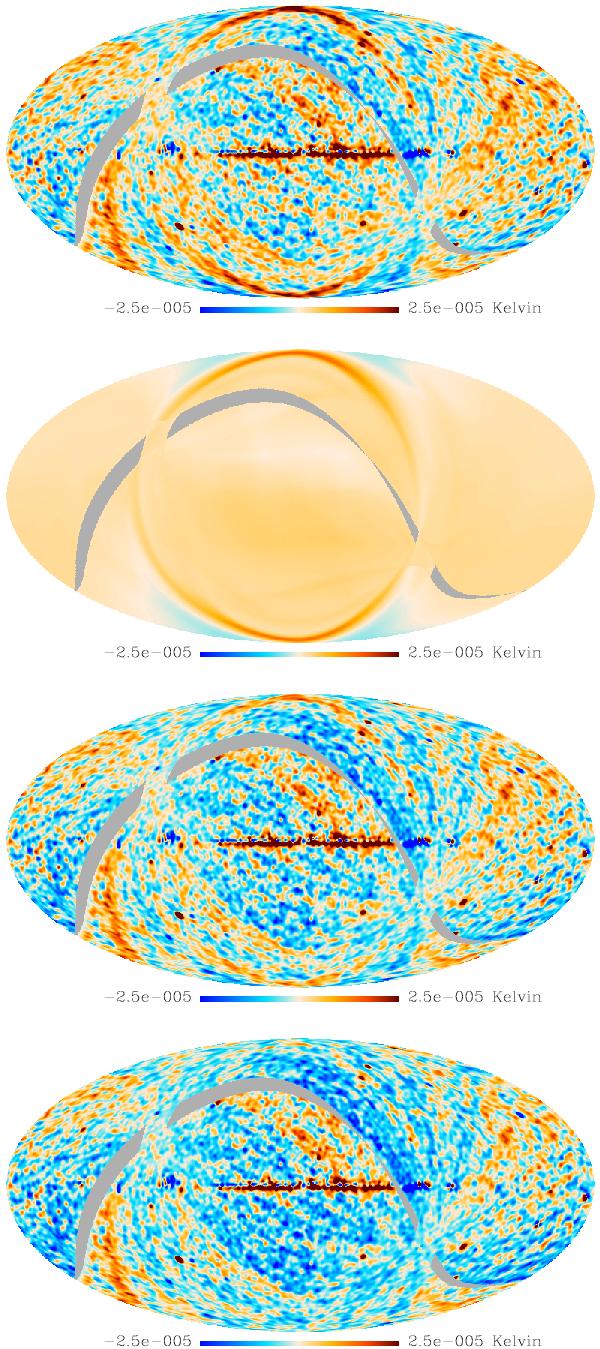
Survey 2 – Survey 1 difference maps for the 30 GHz channel. Top: difference map S2–S1 for the real data, in μK. Second from top: difference map S2–S1 for simulated Galactic straylight. Third from top: simulated difference map subtracted from data difference map (difference between the first two panels). The ring still visible in the third panel suggests that the model should be improved by adding higher order contributions, possibly combined with physical optics analysis. Bottom: difference S2–S1 between data and simulations, amplified by a factor equal to the ratio of the power missing the main beam (fsl) and the power entering the simulated sidelobes using the first order approximation (in this case, this ratio is about 1.93). The grey band shows areas not scanned.

Current usage metrics show cumulative count of Article Views (full-text article views including HTML views, PDF and ePub downloads, according to the available data) and Abstracts Views on Vision4Press platform.
Data correspond to usage on the plateform after 2015. The current usage metrics is available 48-96 hours after online publication and is updated daily on week days.
Initial download of the metrics may take a while.