Fig. 9
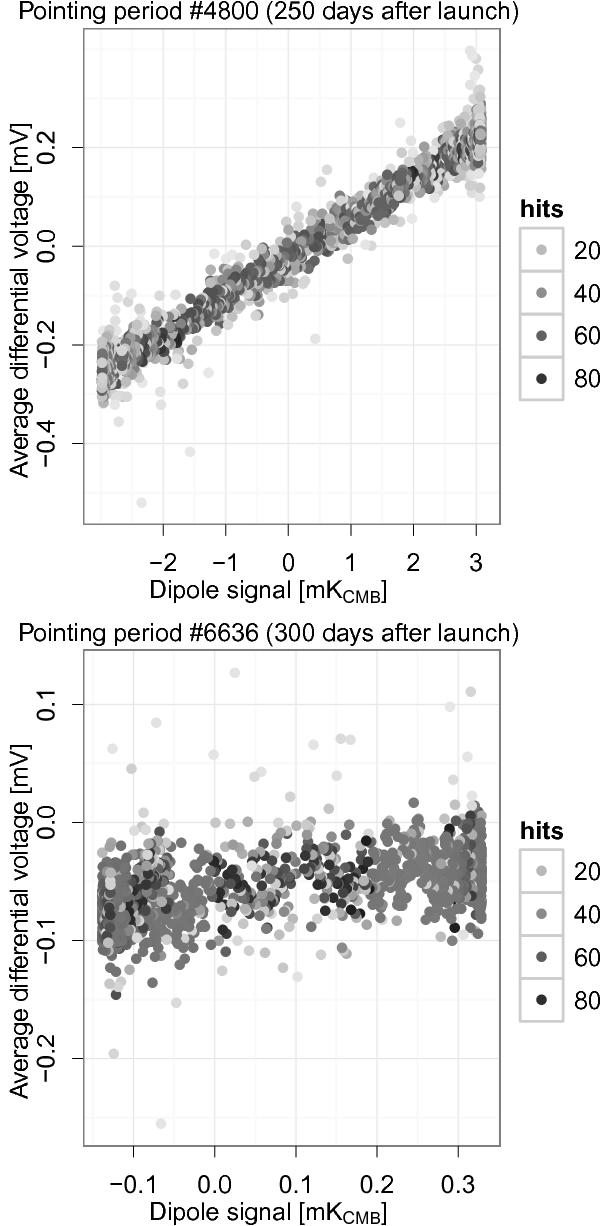
The iterative calibration procedure fits the differential voltages with the expected dipolar signal (KCMB), both projected on a map, and it calculates the gain according to Eq. (27). As Fig. 8 shows, depending on the position of the circle with respect to the axis of the dipole signal, the range spanned by the signal can be either large (dipole maximum, top) or small (dipole minimum, bottom). Of course, in the latter case the estimation of the gain suffers from a larger statistical error.
Current usage metrics show cumulative count of Article Views (full-text article views including HTML views, PDF and ePub downloads, according to the available data) and Abstracts Views on Vision4Press platform.
Data correspond to usage on the plateform after 2015. The current usage metrics is available 48-96 hours after online publication and is updated daily on week days.
Initial download of the metrics may take a while.